U.S. Smart Home Market Size & Outlook, 2025-2030
Related Markets
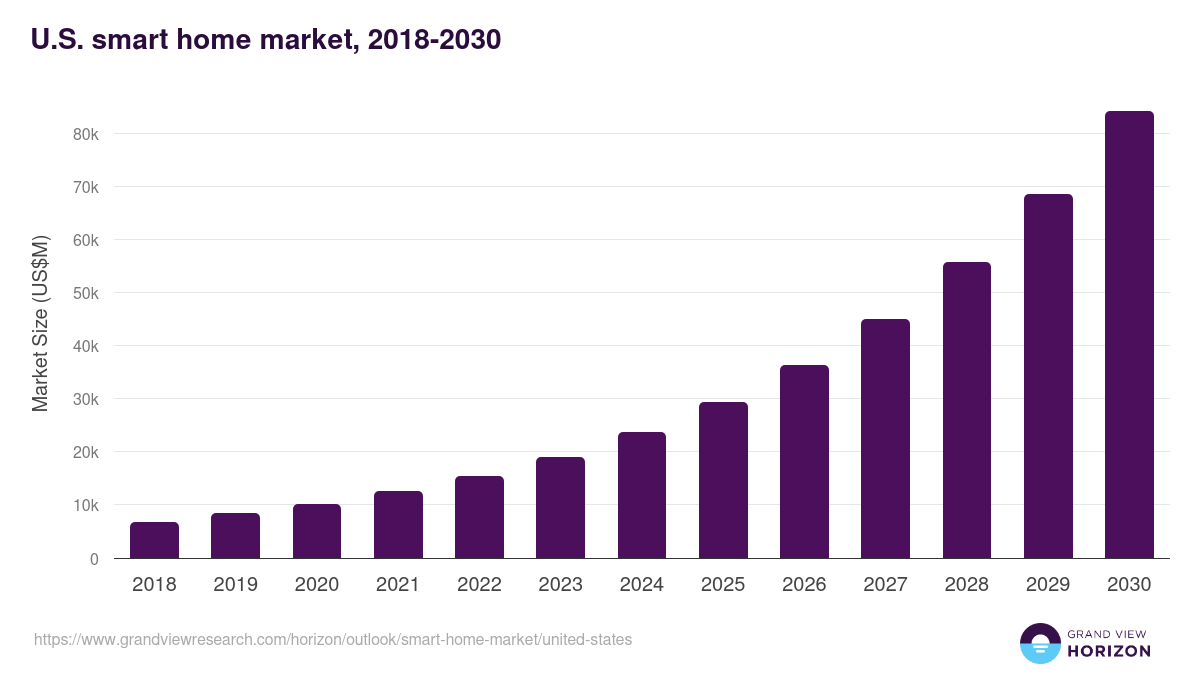
U.S. smart home market highlights
- The U.S. smart home market generated a revenue of USD 23,716.2 million in 2024 and is expected to reach USD 84,201.1 million by 2030.
- The U.S. market is expected to grow at a CAGR of 23.4% from 2025 to 2030.
- In terms of segment, security & access controls was the largest revenue generating product in 2024.
- Home Healthcare is the most lucrative product segment registering the fastest growth during the forecast period.
Smart home market data book summary
| Market revenue in 2024 | USD 23,716.2 million |
| Market revenue in 2030 | USD 84,201.1 million |
| Growth rate | 23.4% (CAGR from 2025 to 2030) |
| Largest segment | Security & access controls |
| Fastest growing segment | Home Healthcare |
| Historical data | 2018 - 2023 |
| Base year | 2024 |
| Forecast period | 2025 - 2030 |
| Quantitative units | Revenue in USD million |
| Market segmentation | Security & Access Controls, Entertainment Devices, HVAC, Home Appliances, Home Healthcare, Smart Furniture, Other Devices, Lighting Control, Smart Kitchen Appliances |
| Key market players worldwide | LG Electronics Inc ADR, Siemens AG, Amazon.com Inc, Alphabet Inc Class A, Samsung Electronics Co Ltd, Schneider Electric SE, Legrand SA, Bosch, Assa Abloy AB Class B, Sony Group Corp, ABB Ltd, Koninklijke Philips NV, Honeywell International Inc |
Other key industry trends
- In terms of revenue, U.S. accounted for 18.6% of the global smart home market in 2024.
- Country-wise, U.S. is expected to lead the global market in terms of revenue in 2030.
- In North America, U.S. smart home market is projected to lead the regional market in terms of revenue in 2030.
- Canada is the fastest growing regional market in North America and is projected to reach USD 33,628.6 million by 2030.
No credit card required*
Horizon in a snapshot
- 30K+ Global Market Reports
- 120K+ Country Reports
- 1.2M+ Market Statistics
- 200K+ Company Profiles
- Industry insights and more
Smart Home Market Scope
Smart Home Market Companies
| Name | Profile | # Employees | HQ | Website |
|---|---|---|---|---|
| Legrand SA | View profile | 33910 | 128, Avenue de Lattre de Tassigny, Cedex, Limoges, France, 87045 | https://www.legrand.com |
| Assa Abloy AB Class B | View profile | 61282 | Klarabergsviadukten 90, P.O. Box 70340, Stockholm, Sweden, SE-107 23 | https://www.assaabloy.com |
| Bosch | View profile | 10001+ | Stuttgart, Baden-Wurttemberg, Germany, Europe | http://www.bosch.com |
| LG Electronics Inc ADR | View profile | 35111 | Twin Tower 128, Yeoui-daero, Yeongdeungpo-gu, Seoul, Korea, Republic of, 07336 | https://www.lge.co.kr |
| Samsung Electronics Co Ltd | View profile | 124804 | 129, Samsung-ro, Yeongtong-gu, Gyeonggi-do, Suwon-si, Korea, Republic of, 443-742 | https://www.samsung.com |
| Honeywell International Inc | View profile | 95000 | 855 South Mint Street, Charlotte, NC, United States, 28202 | https://www.honeywell.com |
| Siemens AG | View profile | 321000 | Werner-von-Siemens-Strabe 1, Munich, BY, Germany, 80333 | https://www.siemens.com |
| ABB Ltd | View profile | 108700 | Affolternstrasse 44, Zurich, Switzerland, 8050 | https://www.abb.com |
| Alphabet Inc Class A | View profile | 180895 | 1600 Amphitheatre Parkway, Mountain View, CA, United States, 94043 | https://www.abc.xyz |
| Sony Group Corp | View profile | 113000 | 7-1, Konan 1-Chome, Minato-ku, Tokyo, Japan, 108-0075 | https://www.sony.com |
| Schneider Electric SE | View profile | 162339 | 35, rue Joseph Monier - CS 30323, Rueil Malmaison, France, F-92506 | https://www.se.com |
| Koninklijke Philips NV | View profile | 73712 | Philips Center, Amstelplein 2, Amsterdam, Netherlands, 1096 BC | https://www.philips.com |
| Amazon.com Inc | View profile | 1525000 | 410 Terry Avenue North, Seattle, WA, United States, 98109-5210 | https://www.amazon.com |
U.S. smart home market outlook
The databook is designed to serve as a comprehensive guide to navigating this sector. The databook focuses on market statistics denoted in the form of revenue and y-o-y growth and CAGR across the globe and regions. A detailed competitive and opportunity analyses related to smart home market will help companies and investors design strategic landscapes.
Security & access controls was the largest segment with a revenue share of 33.96% in 2024. Horizon Databook has segmented the U.S. smart home market based on security & access controls, entertainment devices, hvac, home appliances, home healthcare, smart furniture, other devices, lighting control, smart kitchen appliances covering the revenue growth of each sub-segment from 2018 to 2030.
The U.S. recorded the highest market share of 72.6% in 2022. The U.S. is the major contributor to the regional market growth owing to the presence of major companies, such as Amazon.com, Inc., Google Nest (Google LLC), Honeywell International, Inc., and their large-scale investments in smart home technology.
Moreover, the trend of acquiring latest technologies in smart devices due to the high disposable income of people across the country is expected to drive the market growth. For instance, in October 2022, Google Nest (Google LLC) launched Nest Doorbell (wired), Nest Wi-Fi Pro, and an update to the Google Home App.
The new products were available in U.S. within the same month. Such advanced product development by market players is expected to drive the market growth.
Reasons to subscribe to U.S. smart home market databook:
-
Access to comprehensive data: Horizon Databook provides over 1 million market statistics and 20,000+ reports, offering extensive coverage across various industries and regions.
-
Informed decision making: Subscribers gain insights into market trends, customer preferences, and competitor strategies, empowering informed business decisions.
-
Cost-Effective solution: It's recognized as the world's most cost-effective market research database, offering high ROI through its vast repository of data and reports.
-
Customizable reports: Tailored reports and analytics allow companies to drill down into specific markets, demographics, or product segments, adapting to unique business needs.
-
Strategic advantage: By staying updated with the latest market intelligence, companies can stay ahead of competitors, anticipate industry shifts, and capitalize on emerging opportunities.
Target buyers of U.S. smart home market databook
-
Our clientele includes a mix of smart home market companies, investment firms, advisory firms & academic institutions.
-
30% of our revenue is generated working with investment firms and helping them identify viable opportunity areas.
-
Approximately 65% of our revenue is generated working with competitive intelligence & market intelligence teams of market participants (manufacturers, service providers, etc.).
-
The rest of the revenue is generated working with academic and research not-for-profit institutes. We do our bit of pro-bono by working with these institutions at subsidized rates.
Horizon Databook provides a detailed overview of country-level data and insights on the U.S. smart home market , including forecasts for subscribers. This country databook contains high-level insights into U.S. smart home market from 2018 to 2030, including revenue numbers, major trends, and company profiles.
Partial client list
U.S. smart home market size, by product, 2018-2030 (US$M)

U.S. Smart Home Market Outlook Share, 2024 & 2030 (US$M)


Related statistics
Sign up - it's easy, and free!
Sign up and get instant basic access to databook, upgrade
when ready, or enjoy our
free plan indefinitely.
Included in Horizon account
- 30K+ Global Market Reports
- 120K+ Country Reports
- 1.2M+ Market Statistics
- 200K+ Company Profiles
- Industry insights and more