U.S. Shipping Container Market Size & Outlook, 2020-2028
Related Markets
U.S. shipping container market highlights
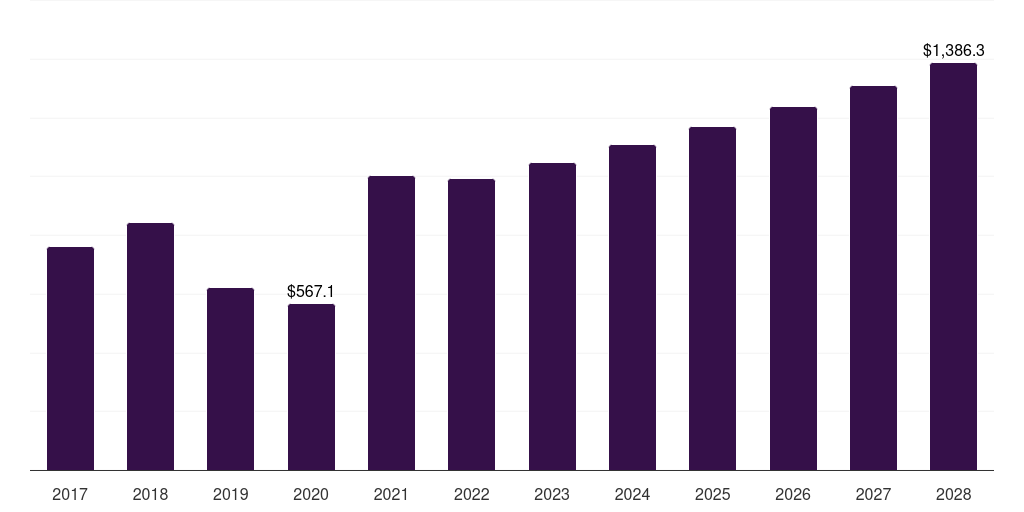
- The U.S. shipping container market generated a revenue of USD 567.1 million in 2020 and is expected to reach USD 1,386.3 million by 2028.
- The U.S. market is expected to grow at a CAGR of 11.8% from 2021 to 2028.
- In terms of segment, iso containers was the largest revenue generating product in 2020.
- ISO Containers is the most lucrative product segment registering the fastest growth during the forecast period.
Shipping container market data book summary
| Market revenue in 2020 | USD 567.1 million |
| Market revenue in 2028 | USD 1,386.3 million |
| Growth rate | 11.8% (CAGR from 2020 to 2028) |
| Largest segment | Iso containers |
| Fastest growing segment | ISO Containers |
| Historical data | 2017 - 2019 |
| Base year | 2020 |
| Forecast period | 2021 - 2028 |
| Quantitative units | Revenue in USD million |
| Market segmentation | ISO Containers, Non-standard Containers |
| Key market players worldwide | A. P. Moller Maersk A/S Class A, China International Marine Containers (Group) Co Ltd Class H, Singamas Container Holdings Ltd, Sea Ltd ADR |
Other key industry trends
- In terms of revenue, U.S. accounted for 8.8% of the global shipping container market in 2020.
- Country-wise, China is expected to lead the global market in terms of revenue in 2028.
- In North America, U.S. shipping container market is projected to lead the regional market in terms of revenue in 2028.
- U.S. is the fastest growing regional market in North America and is projected to reach USD 1,386.3 million by 2028.
No credit card required*
Horizon in a snapshot
- 30K+ Global Market Reports
- 120K+ Country Reports
- 1.2M+ Market Statistics
- 200K+ Company Profiles
- Industry insights and more
Shipping Container Market Scope
Shipping Container Market Companies
| Name | Profile | # Employees | HQ | Website |
|---|---|---|---|---|
| Singamas Container Holdings Ltd | View profile | 3089 | 75-83 King’s Road, 19th Floor, SUP Tower, Hong Kong, Hong Kong | https://www.singamas.com |
| China International Marine Containers (Group) Co Ltd Class H | View profile | 50632 | CIMC R&D Centre, 2 Gangwan Avenue, 8th Floor, Shekou, Nanshan Distritct, Guangdong, Shenzhen, China, People's Republic of, 518067 | https://www.cimc.com |
| A. P. Moller Maersk A/S Class A | View profile | 100000 | Esplanaden 50, Copenhagen, Denmark, 1263 | https://www.maersk.com |
| Sea Ltd ADR | View profile | 62700 | 1 Fusionopolis Place, No. 17-10, Galaxis, Singapore, Singapore, 138522 | https://www.sea.com |
U.S. shipping container market outlook
The databook is designed to serve as a comprehensive guide to navigating this sector. The databook focuses on market statistics denoted in the form of revenue and y-o-y growth and CAGR across the globe and regions. A detailed competitive and opportunity analyses related to shipping container market will help companies and investors design strategic landscapes.
Iso containers was the largest segment with a revenue share of 96.3% in 2020. Horizon Databook has segmented the U.S. shipping container market based on iso containers, non-standard containers covering the revenue growth of each sub-segment from 2017 to 2028.
The U.S. has one of the largest pharmaceutical markets worldwide and is one of the top 3 importers and exporters of medical products. Large investments in drug development, production of different healthcare products, and their exports are projected to offer opportunities for shipping container vendors.
As per the data provided by World Trade Association, globally medical products account for around 5% of the global trade (imports & exports), out of which, over 50% imports are pharmaceuticals. U.S. is the second-largest exporter of medical products including medical equipment, medical supplies, medicines, and personal protective products.
The country exported medical products worth USD 116.6 billion in 2019, registering a share of 12% in global exports. For such applications, shipping containers are the key medium for transportation. Thus, with growing exports, the demand for shipping containers is also expected to rise over the forecast period.
Reasons to subscribe to U.S. shipping container market databook:
-
Access to comprehensive data: Horizon Databook provides over 1 million market statistics and 20,000+ reports, offering extensive coverage across various industries and regions.
-
Informed decision making: Subscribers gain insights into market trends, customer preferences, and competitor strategies, empowering informed business decisions.
-
Cost-Effective solution: It's recognized as the world's most cost-effective market research database, offering high ROI through its vast repository of data and reports.
-
Customizable reports: Tailored reports and analytics allow companies to drill down into specific markets, demographics, or product segments, adapting to unique business needs.
-
Strategic advantage: By staying updated with the latest market intelligence, companies can stay ahead of competitors, anticipate industry shifts, and capitalize on emerging opportunities.
Target buyers of U.S. shipping container market databook
-
Our clientele includes a mix of shipping container market companies, investment firms, advisory firms & academic institutions.
-
30% of our revenue is generated working with investment firms and helping them identify viable opportunity areas.
-
Approximately 65% of our revenue is generated working with competitive intelligence & market intelligence teams of market participants (manufacturers, service providers, etc.).
-
The rest of the revenue is generated working with academic and research not-for-profit institutes. We do our bit of pro-bono by working with these institutions at subsidized rates.
Horizon Databook provides a detailed overview of country-level data and insights on the U.S. shipping container market, including forecasts for subscribers. This country databook contains high-level insights into U.S. shipping container market from 2017 to 2028, including revenue numbers, major trends, and company profiles.
Partial client list
U.S. shipping container market report size, by product, 2017-2028 (US$M)

U.S. Shipping Container Market Share, 2020 & 2028 (US$M)


Related statistics
Sign up - it's easy, and free!
Sign up and get instant basic access to databook, upgrade
when ready, or enjoy our
free plan indefinitely.
Included in Horizon account
- 30K+ Global Market Reports
- 120K+ Country Reports
- 1.2M+ Market Statistics
- 200K+ Company Profiles
- Industry insights and more