U.S. Red Biotechnology Market Size & Outlook, 2025-2030
Related Markets
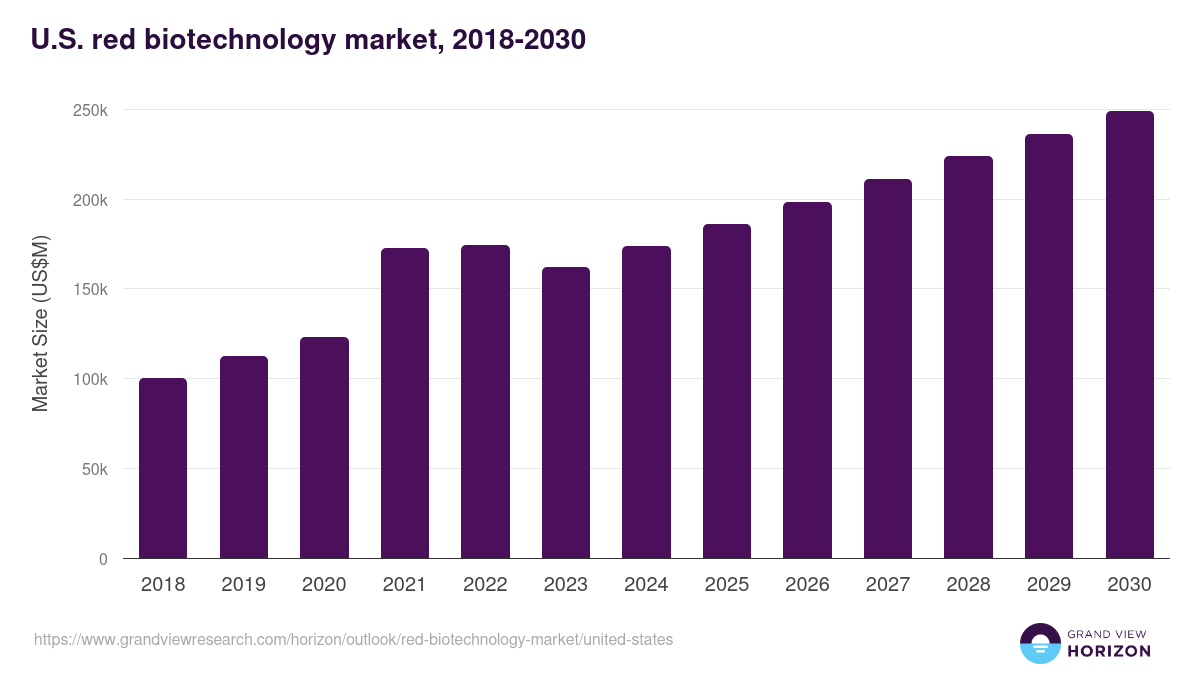
U.S. red biotechnology market highlights
- The U.S. red biotechnology market generated a revenue of USD 173,972.8 million in 2024 and is expected to reach USD 248,963.1 million by 2030.
- The U.S. market is expected to grow at a CAGR of 6% from 2025 to 2030.
- In terms of segment, monoclonal antibodies was the largest revenue generating product in 2024.
- Gene Therapy Products is the most lucrative product segment registering the fastest growth during the forecast period.
Red biotechnology market data book summary
| Market revenue in 2024 | USD 173,972.8 million |
| Market revenue in 2030 | USD 248,963.1 million |
| Growth rate | 6% (CAGR from 2025 to 2030) |
| Largest segment | Monoclonal antibodies |
| Fastest growing segment | Gene Therapy Products |
| Historical data | 2018 - 2023 |
| Base year | 2024 |
| Forecast period | 2025 - 2030 |
| Quantitative units | Revenue in USD million |
| Market segmentation | Monoclonal Antibodies, Polyclonal Antibodies, Recombinant Proteins, Vaccines, Cell-Based Immunotherapy Products, Gene Therapy Products, Cell Therapy Products, Tissue-Engineered Products, Stem Cells, Cell Culture, Viral Vector, Enzymes, Kits and Reagents, Animal Models, Molecular Diagnostics |
| Key market players worldwide | Merck KGaA, Roche Holding AG ADR, Pfizer Inc, Regeneron Pharmaceuticals Inc, AstraZeneca PLC, Gilead Sciences Inc, Biogen Inc, Amgen Inc, Bristol-Myers Squibb Co, Takeda Pharmaceutical Co Ltd |
Other key industry trends
- In terms of revenue, U.S. accounted for 31.8% of the global red biotechnology market in 2024.
- Country-wise, U.S. is expected to lead the global market in terms of revenue in 2030.
- In North America, U.S. red biotechnology market is projected to lead the regional market in terms of revenue in 2030.
- Mexico is the fastest growing regional market in North America and is projected to reach USD 15,511.5 million by 2030.
No credit card required*
Horizon in a snapshot
- 30K+ Global Market Reports
- 120K+ Country Reports
- 1.2M+ Market Statistics
- 200K+ Company Profiles
- Industry insights and more
Red Biotechnology Market Scope
Red Biotechnology Market Companies
| Name | Profile | # Employees | HQ | Website |
|---|---|---|---|---|
| Takeda Pharmaceutical Co Ltd | View profile | 49095 | 1-1, Nihonbashi-Honcho 2-Chome, Chuo-ku, Tokyo, Japan, 103-8668 | https://www.takeda.com |
| Biogen Inc | View profile | 7570 | 225 Binney Street, Cambridge, MA, United States, 02142 | https://www.biogen.com |
| Gilead Sciences Inc | View profile | 18000 | 333 Lakeside Drive, Foster, CA, United States, 94404 | https://www.gilead.com |
| AstraZeneca PLC | View profile | 89900 | 1 Francis Crick Avenue, Cambridge Biomedical Campus, Cambridge, United Kingdom, CB2 0AA | https://www.astrazeneca.com |
| Regeneron Pharmaceuticals Inc | View profile | 13450 | 777 Old Saw Mill River Road, Tarrytown, NY, United States, 10591-6707 | https://www.regeneron.com |
| Bristol-Myers Squibb Co | View profile | 34100 | Route 206 and Province Line Road, Princeton, New Jersey, NJ, United States, 08543 | https://www.bms.com |
| Pfizer Inc | View profile | 88000 | 66 Hudson Boulevard East, New York, NY, United States, 10001-2192 | https://www.pfizer.com |
| Merck KGaA | View profile | 62345 | Frankfurter Strasse 250, Darmstadt, HE, Germany, 64293 | https://www.emdgroup.com |
| Roche Holding AG ADR | View profile | 103605 | Grenzacherstrasse 124, Basel, Switzerland, 4070 | https://www.roche.com |
| Amgen Inc | View profile | 26700 | One Amgen Center Drive, Thousand Oaks, CA, United States, 91320-1799 | https://www.amgen.com |
U.S. red biotechnology market outlook
The databook is designed to serve as a comprehensive guide to navigating this sector. The databook focuses on market statistics denoted in the form of revenue and y-o-y growth and CAGR across the globe and regions. A detailed competitive and opportunity analyses related to red biotechnology market will help companies and investors design strategic landscapes.
Monoclonal antibodies was the largest segment with a revenue share of 50.71% in 2024. Horizon Databook has segmented the U.S. red biotechnology market based on monoclonal antibodies, polyclonal antibodies, recombinant proteins, vaccines, cell-based immunotherapy products, gene therapy products, cell therapy products, tissue-engineered products, stem cells, cell culture, viral vector, enzymes, kits and reagents, animal models, molecular diagnostics covering the revenue growth of each sub-segment from 2018 to 2030.
Reasons to subscribe to U.S. red biotechnology market databook:
-
Access to comprehensive data: Horizon Databook provides over 1 million market statistics and 20,000+ reports, offering extensive coverage across various industries and regions.
-
Informed decision making: Subscribers gain insights into market trends, customer preferences, and competitor strategies, empowering informed business decisions.
-
Cost-Effective solution: It's recognized as the world's most cost-effective market research database, offering high ROI through its vast repository of data and reports.
-
Customizable reports: Tailored reports and analytics allow companies to drill down into specific markets, demographics, or product segments, adapting to unique business needs.
-
Strategic advantage: By staying updated with the latest market intelligence, companies can stay ahead of competitors, anticipate industry shifts, and capitalize on emerging opportunities.
Target buyers of U.S. red biotechnology market databook
-
Our clientele includes a mix of red biotechnology market companies, investment firms, advisory firms & academic institutions.
-
30% of our revenue is generated working with investment firms and helping them identify viable opportunity areas.
-
Approximately 65% of our revenue is generated working with competitive intelligence & market intelligence teams of market participants (manufacturers, service providers, etc.).
-
The rest of the revenue is generated working with academic and research not-for-profit institutes. We do our bit of pro-bono by working with these institutions at subsidized rates.
Horizon Databook provides a detailed overview of country-level data and insights on the U.S. red biotechnology market , including forecasts for subscribers. This country databook contains high-level insights into U.S. red biotechnology market from 2018 to 2030, including revenue numbers, major trends, and company profiles.
Partial client list
U.S. red biotechnology market size, by product, 2018-2030 (US$M)

U.S. Red Biotechnology Market Outlook Share, 2024 & 2030 (US$M)


Related statistics
Sign up - it's easy, and free!
Sign up and get instant basic access to databook, upgrade
when ready, or enjoy our
free plan indefinitely.
Included in Horizon account
- 30K+ Global Market Reports
- 120K+ Country Reports
- 1.2M+ Market Statistics
- 200K+ Company Profiles
- Industry insights and more