North America Pea Derivatives Market Size & Outlook
Related Markets
North America pea derivatives market highlights
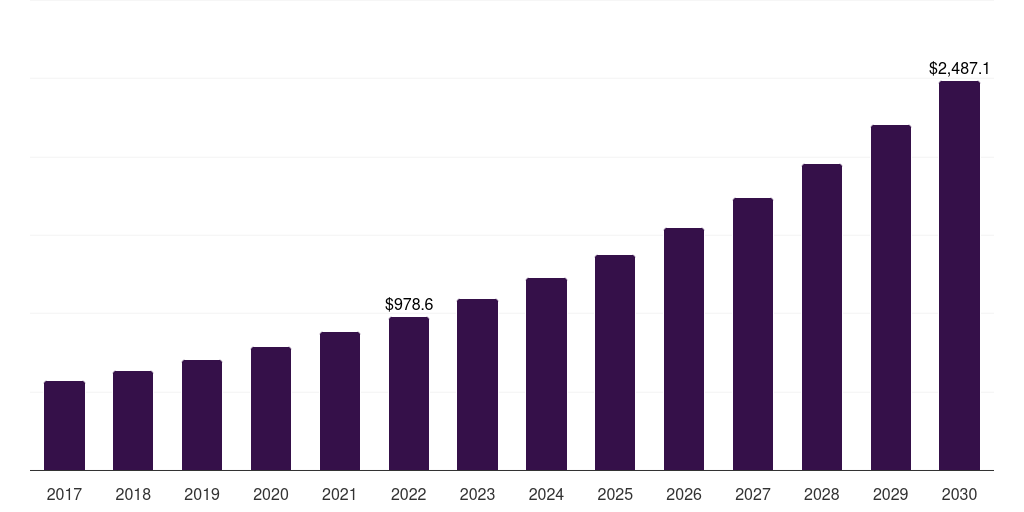
- The North America pea derivatives market generated a revenue of USD 978.6 million in 2022.
- The market is expected to grow at a CAGR of 12.4% from 2023 to 2030.
- In terms of segment, pea protein was the largest revenue generating type in 2022.
- Pea Protein is the most lucrative type segment registering the fastest growth during the forecast period.
- Country-wise, U.S. is expected to register the highest CAGR from 2023 to 2030.
North America data book summary
| Market revenue in 2022 | USD 978.6 million |
| Market revenue in 2030 | USD 2,487.1 million |
| Growth rate | 12.4% (CAGR from 2022 to 2030) |
| Largest segment | Pea protein |
| Fastest growing segment | Pea Protein |
| Historical data covered | 2017 - 2021 |
| Base year for estimation | 2022 |
| Forecast period covered | 2023 - 2030 |
| Quantitative units | Revenue in USD million |
| Market segmentation | Pea Protein, Pea Starch, Pea Fiber |
| Key market players worldwide | International Flavors & Fragrances Inc, NutriPea, Cosucra, Roquette America, Puris, Burcon NutraScience Corp, Sotexpro, The Scoular Company, Fenchem, The Green Labs |
Other key industry trends
- In terms of revenue, North America region accounted for 34.2% of the global pea derivatives market in 2022.
- Globally, North America is projected to lead the regional market in terms of revenue in 2030.
- Asia Pacific is the fastest growing regional market and is projected to reach USD 2,092.0 million by 2030.
No credit card required*
Horizon in a snapshot
- 30K+ Global Market Reports
- 120K+ Country Reports
- 1.2M+ Market Statistics
- 200K+ Company Profiles
- Industry insights and more
Pea Derivatives Market Scope
Pea Derivatives Market Companies
| Name | Profile | # Employees | HQ | Website |
|---|---|---|---|---|
| The Green Labs | View profile | 1-10 | Clifton, New Jersey, United States, North America | https://www.thegreenlabs.com/ |
| Fenchem | View profile | 251-500 | Nanjing, Jiangsu, China, Asia | http://www.fenchem.com |
| The Scoular Company | View profile | 1001-5000 | Omaha, Nebraska, United States, North America | http://www.scoular.com/ |
| Sotexpro | View profile | 101-250 | Berméricourt, Champagne-Ardenne, France, Europe | https://www.sotexpro.com |
| Burcon NutraScience Corp | View profile | 26 | 1946 West Broadway, Vancouver, BC, Canada, V6J 1Z2 | https://www.burcon.ca |
| Puris | View profile | 101-250 | Minneapolis, Minnesota, United States, North America | https://puris.com/ |
| Roquette America | View profile | 5001-10000 | Gurnee, Illinois, United States, North America | https://www.roquette.com/ |
| Cosucra | View profile | 251-500 | Warcoing, Hainaut, Belgium, Europe | https://www.cosucra.com/ |
| NutriPea | View profile | 101-250 | Portage La Prairie, Manitoba, Canada, North America | https://www.nutripea.com |
| International Flavors & Fragrances Inc | View profile | 21500 | 521 West 57th Street, New York, NY, United States, 10019-2960 | https://www.iff.com |
North America pea derivatives market outlook
The databook is designed to serve as a comprehensive guide to navigating this sector. The databook focuses on market statistics denoted in the form of revenue and y-o-y growth and CAGR across the globe and regions. A detailed competitive and opportunity analyses related to pea derivatives market will help companies and investors design strategic landscapes.
Pea protein was the largest segment with a revenue share of 65.69% in 2022. Horizon Databook has segmented the North America pea derivatives market based on pea protein, pea starch, pea fiber covering the revenue growth of each sub-segment from 2017 to 2030.
The North American pea derivatives market is expected to experience significant growth in the coming years, driven by the increasing consumption of energy bars, cold cereals, and snacks. Canada, in particular, is home to several pea protein manufacturers such as Burcon, Nutri-Pea, and Roquette.
This is due to the extensive cultivation of peas in the country, which has led to a high availability of peabased products in the market, thereby favoring the market growth in North America.
The demand for pea derivatives is also being fueled by the growing trend of plant-based diets and the increasing awareness about the health benefits of consuming protein-rich foods.
Reasons to subscribe to North America pea derivatives market databook:
-
Access to comprehensive data: Horizon Databook provides over 1 million market statistics and 20,000+ reports, offering extensive coverage across various industries and regions.
-
Informed decision making: Subscribers gain insights into market trends, customer preferences, and competitor strategies, empowering informed business decisions.
-
Cost-Effective solution: It's recognized as the world's most cost-effective market research database, offering high ROI through its vast repository of data and reports.
-
Customizable reports: Tailored reports and analytics allow companies to drill down into specific markets, demographics, or product segments, adapting to unique business needs.
-
Strategic advantage: By staying updated with the latest market intelligence, companies can stay ahead of competitors, anticipate industry shifts, and capitalize on emerging opportunities.
Target buyers of North America pea derivatives market databook
-
Our clientele includes a mix of pea derivatives market companies, investment firms, advisory firms & academic institutions.
-
30% of our revenue is generated working with investment firms and helping them identify viable opportunity areas.
-
Approximately 65% of our revenue is generated working with competitive intelligence & market intelligence teams of market participants (manufacturers, service providers, etc.).
-
The rest of the revenue is generated working with academic and research not-for-profit institutes. We do our bit of pro-bono by working with these institutions at subsidized rates.
Horizon Databook provides a detailed overview of continent-level data and insights on the North America pea derivatives market , including forecasts for subscribers. This continent databook contains high-level insights into North America pea derivatives market from 2017 to 2030, including revenue numbers, major trends, and company profiles.
Partial client list
North America pea derivatives market size, by country, 2017-2030 (US$M)

North America Pea Derivatives Market Outlook Share, 2022 & 2030 (US$M)


Related statistics
Sign up - it's easy, and free!
Sign up and get instant basic access to databook, upgrade
when ready, or enjoy our
free plan indefinitely.
Included in Horizon account
- 30K+ Global Market Reports
- 120K+ Country Reports
- 1.2M+ Market Statistics
- 200K+ Company Profiles
- Industry insights and more