U.S. Operational Technology Market Size & Outlook, 2025-2030
Related Markets
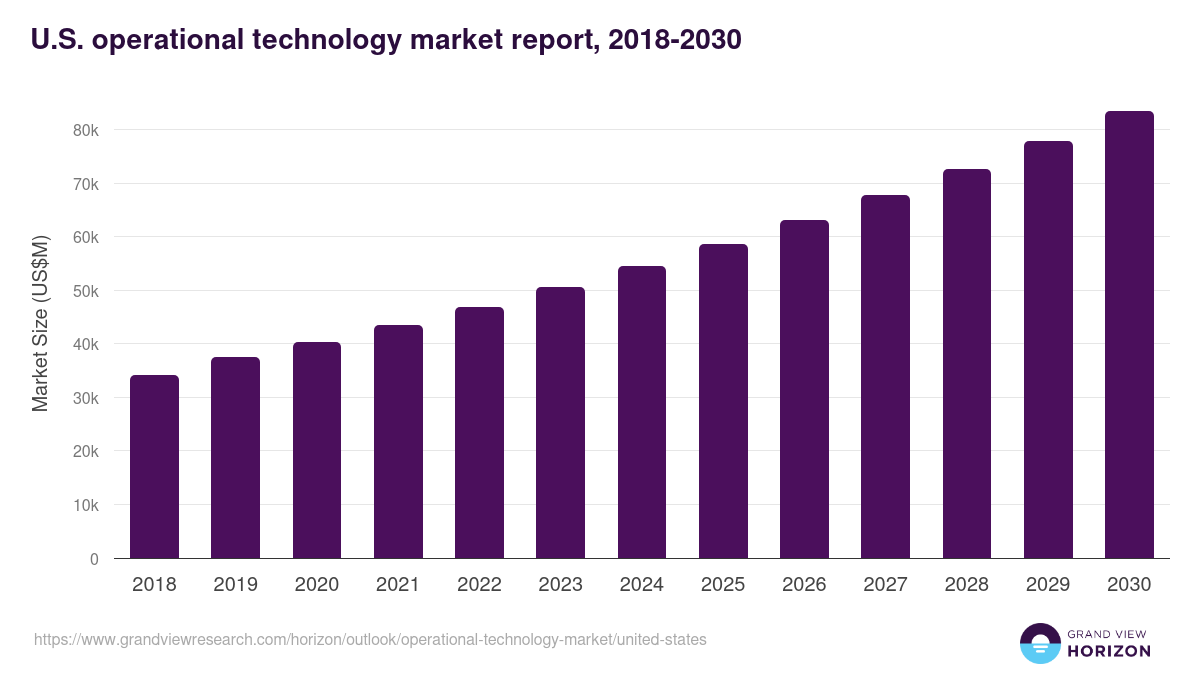
U.S. operational technology market highlights
- The U.S. operational technology market generated a revenue of USD 50,565.9 million in 2023 and is expected to reach USD 83,433.2 million by 2030.
- The U.S. market is expected to grow at a CAGR of 7.4% from 2024 to 2030.
- In terms of segment, computer numerical control was the largest revenue generating component in 2023.
- Building Management System is the most lucrative component segment registering the fastest growth during the forecast period.
Operational technology market data book summary
| Market revenue in 2023 | USD 50,565.9 million |
| Market revenue in 2030 | USD 83,433.2 million |
| Growth rate | 7.4% (CAGR from 2023 to 2030) |
| Largest segment | Computer numerical control |
| Fastest growing segment | Building Management System |
| Historical data | 2018 - 2022 |
| Base year | 2023 |
| Forecast period | 2024 - 2030 |
| Quantitative units | Revenue in USD million |
| Market segmentation | Supervisory Control and Data Acquisition, Distributed Control System, Manufacturing Execution System Market, Functional Safety, Building Management System, Plant Asset Management, Variable Frequency Drives, Computer Numerical Control |
| Key market players worldwide | ABB Ltd, Emerson Electric Co, GE Aerospace, Hitachi Ltd, Honeywell International Inc, International Business Machines Corp, OMRON Corp, Rockwell Automation Inc, Siemens AG, Schneider Electric SE |
Other key industry trends
- In terms of revenue, U.S. accounted for 26.5% of the global operational technology market in 2023.
- Country-wise, U.S. is expected to lead the global market in terms of revenue in 2030.
- In North America, U.S. operational technology market is projected to lead the regional market in terms of revenue in 2030.
- Canada is the fastest growing regional market in North America and is projected to reach USD 37,660.0 million by 2030.
No credit card required*
Horizon in a snapshot
- 30K+ Global Market Reports
- 120K+ Country Reports
- 1.2M+ Market Statistics
- 200K+ Company Profiles
- Industry insights and more
Operational Technology Market Scope
Operational Technology Market Companies
| Name | Profile | # Employees | HQ | Website |
|---|---|---|---|---|
| Emerson Electric Co | View profile | 67000 | 8000 West Florissant Avenue, P.O. Box 4100, St. Louis, MO, United States, 63136 | https://www.emerson.com |
| Honeywell International Inc | View profile | 95000 | 855 South Mint Street, Charlotte, NC, United States, 28202 | https://www.honeywell.com |
| Rockwell Automation Inc | View profile | 29000 | 1201 South Second Street, Milwaukee, WI, United States, 53204 | https://www.rockwellautomation.com |
| GE Aerospace | View profile | 125000 | One Financial Center, Suite 3700, Boston, MA, United States, 02111 | https://www.geaerospace.com |
| Siemens AG | View profile | 321000 | Werner-von-Siemens-Strabe 1, Munich, BY, Germany, 80333 | https://www.siemens.com |
| ABB Ltd | View profile | 108700 | Affolternstrasse 44, Zurich, Switzerland, 8050 | https://www.abb.com |
| OMRON Corp | View profile | 28034 | Shiokoji Horikawa, Shimogyo-ku, Kyoto, Japan, 600-8530 | http://www.omron.co.jp |
| International Business Machines Corp | View profile | 282200 | One New Orchard Road, Armonk, NY, United States, 10504 | http://www.ibm.com |
| Schneider Electric SE | View profile | 162339 | 35, rue Joseph Monier - CS 30323, Rueil Malmaison, France, F-92506 | https://www.se.com |
| Hitachi Ltd | View profile | 322525 | 6-6, Marunouchi 1-chome, Chiyoda-ku, Tokyo, Japan, 100-8280 | http://www.hitachi.com |
U.S. operational technology market outlook
The databook is designed to serve as a comprehensive guide to navigating this sector. The databook focuses on market statistics denoted in the form of revenue and y-o-y growth and CAGR across the globe and regions. A detailed competitive and opportunity analyses related to operational technology market will help companies and investors design strategic landscapes.
Computer numerical control was the largest segment with a revenue share of 34.3% in 2024. Horizon Databook has segmented the U.S. operational technology market based on supervisory control and data acquisition, distributed control system, manufacturing execution system market, functional safety, building management system, plant asset management, variable frequency drives, computer numerical control covering the revenue growth of each sub-segment from 2018 to 2030.
Reshoring efforts in the U.S. are driving the need for investments in modern operational technology solutions to enhance manufacturing efficiency. Simultaneously, the evolving energy sector, driven by the increased use of renewables and grid modernization, requires advanced operational technology solutions to manage and optimize complex energy systems effectively.
Moreover, The U.S. government actively promotes operational technology adoption through initiatives such as the Internet of Things Advisory Board (IoTFWG), established by the National Defense Authorization Act of 2021, which focuses on secure IoT deployment and provides guidance to businesses and government agencies.
Reasons to subscribe to U.S. operational technology market databook:
-
Access to comprehensive data: Horizon Databook provides over 1 million market statistics and 20,000+ reports, offering extensive coverage across various industries and regions.
-
Informed decision making: Subscribers gain insights into market trends, customer preferences, and competitor strategies, empowering informed business decisions.
-
Cost-Effective solution: It's recognized as the world's most cost-effective market research database, offering high ROI through its vast repository of data and reports.
-
Customizable reports: Tailored reports and analytics allow companies to drill down into specific markets, demographics, or product segments, adapting to unique business needs.
-
Strategic advantage: By staying updated with the latest market intelligence, companies can stay ahead of competitors, anticipate industry shifts, and capitalize on emerging opportunities.
Target buyers of U.S. operational technology market databook
-
Our clientele includes a mix of operational technology market companies, investment firms, advisory firms & academic institutions.
-
30% of our revenue is generated working with investment firms and helping them identify viable opportunity areas.
-
Approximately 65% of our revenue is generated working with competitive intelligence & market intelligence teams of market participants (manufacturers, service providers, etc.).
-
The rest of the revenue is generated working with academic and research not-for-profit institutes. We do our bit of pro-bono by working with these institutions at subsidized rates.
Horizon Databook provides a detailed overview of country-level data and insights on the U.S. operational technology market, including forecasts for subscribers. This country databook contains high-level insights into U.S. operational technology market from 2018 to 2030, including revenue numbers, major trends, and company profiles.
Partial client list
U.S. operational technology market report size, by component, 2018-2030 (US$M)

U.S. Operational Technology Market Share, 2024 & 2030 (US$M)


Related statistics
Sign up - it's easy, and free!
Sign up and get instant basic access to databook, upgrade
when ready, or enjoy our
free plan indefinitely.
Included in Horizon account
- 30K+ Global Market Reports
- 120K+ Country Reports
- 1.2M+ Market Statistics
- 200K+ Company Profiles
- Industry insights and more