South Africa Non-alcoholic Beverages Market Size & Outlook
Related Markets
South Africa non-alcoholic beverages market highlights
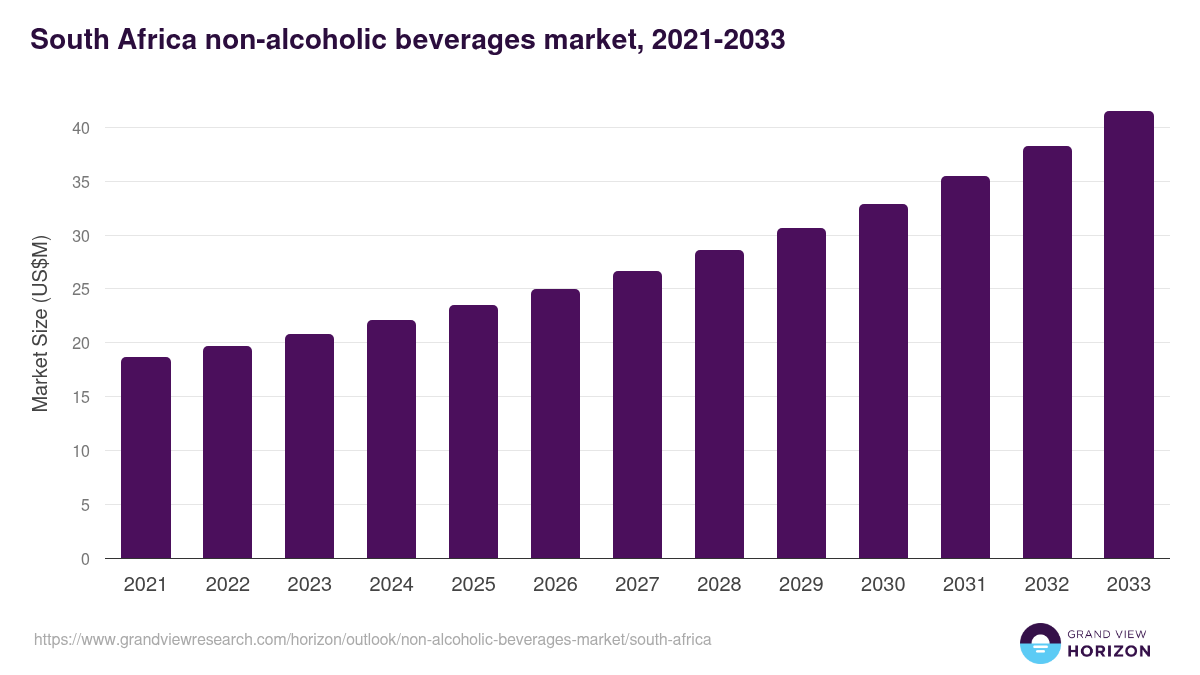
- The South Africa non-alcoholic beverages market generated a revenue of USD 23.5 million in 2025 and is expected to reach USD 41.5 million by 2033.
- The South Africa market is expected to grow at a CAGR of 7.5% from 2026 to 2033.
- In terms of segment, carbonated soft drinks was the largest revenue generating product in 2025.
- Functional Beverages is the most lucrative product segment registering the fastest growth during the forecast period.
Non-alcoholic beverages market data book summary
| Market revenue in 2025 | USD 23.5 million |
| Market revenue in 2033 | USD 41.5 million |
| Growth rate | 7.5% (CAGR from 2026 to 2033) |
| Largest segment | Carbonated soft drinks |
| Fastest growing segment | Functional Beverages |
| Historical data | 2021 - 2024 |
| Base year | 2025 |
| Forecast period | 2026 - 2033 |
| Quantitative units | Revenue in USD million |
| Market segmentation | Carbonated Soft Drinks, Bottled Water, RTD Tea & Coffee, Functional Beverages, Juices, Dairy based Beverages |
| Key market players worldwide | Nestle SA, PepsiCo Inc, Unilever PLC, Keurig Dr Pepper Inc, Coca-Cola Co, Jones Soda Co, Danone SA, Suntory Beverage & Food Ltd, Asahi Group Holdings Ltd, Red Bull |
Other key industry trends
- In terms of revenue, South Africa accounted for 1.7% of the global non-alcoholic beverages market in 2025.
- Country-wise, U.S. is expected to lead the global market in terms of revenue in 2033.
- In Middle East & Africa, South Africa non-alcoholic beverages market is projected to lead the regional market in terms of revenue in 2033.
- South Africa is the fastest growing regional market in Middle East & Africa and is projected to reach USD 41.5 million by 2033.
No credit card required*
Horizon in a snapshot
- 30K+ Global Market Reports
- 120K+ Country Reports
- 1.2M+ Market Statistics
- 200K+ Company Profiles
- Industry insights and more
Non-alcoholic Beverages Market Scope
Non-alcoholic Beverages Market Companies
| Name | Profile | # Employees | HQ | Website |
|---|---|---|---|---|
| Red Bull | View profile | 10001+ | Fuschl Am See, Salzburg, Austria, Europe | https://redbull.com |
| Coca-Cola Co | View profile | 79100 | One Coca-Cola Plaza, Atlanta, GA, United States, 30313 | https://www.coca-colacompany.com |
| Jones Soda Co | View profile | 27 | 4786 1st Avenue South, Suite 103, Seattle, WA, United States, 98134 | https://www.jonessoda.com |
| Keurig Dr Pepper Inc | View profile | 28100 | 53 South Avenue, Burlington, MA, United States, 01803 | https://www.keurigdrpepper.com |
| Asahi Group Holdings Ltd | View profile | 34728 | 1-23-1, Azumabashi, Sumida-ku, Tokyo, Japan, 130-8602 | http://www.asahigroup-holdings.com |
| Suntory Beverage & Food Ltd | View profile | 24641 | 3-1-1 Kyobashi, Tokyo Square Garden, Chuo-ku, Tokyo, Japan, 104-0031 | http://www.suntory.co.jp |
| Unilever PLC | View profile | 128377 | 100 Victoria Embankment, London, United Kingdom, EC4Y 0DY | https://www.unilever.com |
| PepsiCo Inc | View profile | 318000 | 700 Anderson Hill Road, Purchase, NY, United States, 10577 | https://www.pepsico.com |
| Danone SA | View profile | 88843 | 17, Boulevard Haussmann, Paris, France, 75009 | https://www.danone.com |
| Nestle SA | View profile | 270000 | Avenue Nestle 55, Vevey, Switzerland, CH-1800 | https://www.nestle.com |
South Africa non-alcoholic beverages market outlook
The databook is designed to serve as a comprehensive guide to navigating this sector. The databook focuses on market statistics denoted in the form of revenue and y-o-y growth and CAGR across the globe and regions. A detailed competitive and opportunity analyses related to non-alcoholic beverages market will help companies and investors design strategic landscapes.
Carbonated soft drinks was the largest segment with a revenue share of 25.96% in 2025. Horizon Databook has segmented the South Africa non-alcoholic beverages market based on carbonated soft drinks, bottled water, rtd tea & coffee, functional beverages, juices, dairy based beverages covering the revenue growth of each sub-segment from 2021 to 2033.
The popularity of non-alcoholic beverages has risen notably among younger consumers, especially the Gen Z demographic. This group tends to view drinking differently than previous generations, showing less interest in alcohol consumption.
This health-focused mindset has led to a growing demand for non-alcoholic options, allowing people to prioritize their health while not completely forsaking alcoholic beverages. The consumer base for no/low-alcohol beverages is maturing, with Gen Z being the largest age group.
According to BMC Medicine, in 2020, South Africa's total sales of alcohol-free beverages reached 1.34 million cases, with beer constituting the largest share. COVID-19- induced alcohol sales restrictions and a growing awareness of alcohol-free drinks partly influenced this trend.
Reasons to subscribe to South Africa non-alcoholic beverages market databook:
-
Access to comprehensive data: Horizon Databook provides over 1 million market statistics and 20,000+ reports, offering extensive coverage across various industries and regions.
-
Informed decision making: Subscribers gain insights into market trends, customer preferences, and competitor strategies, empowering informed business decisions.
-
Cost-Effective solution: It's recognized as the world's most cost-effective market research database, offering high ROI through its vast repository of data and reports.
-
Customizable reports: Tailored reports and analytics allow companies to drill down into specific markets, demographics, or product segments, adapting to unique business needs.
-
Strategic advantage: By staying updated with the latest market intelligence, companies can stay ahead of competitors, anticipate industry shifts, and capitalize on emerging opportunities.
Target buyers of South Africa non-alcoholic beverages market databook
-
Our clientele includes a mix of non-alcoholic beverages market companies, investment firms, advisory firms & academic institutions.
-
30% of our revenue is generated working with investment firms and helping them identify viable opportunity areas.
-
Approximately 65% of our revenue is generated working with competitive intelligence & market intelligence teams of market participants (manufacturers, service providers, etc.).
-
The rest of the revenue is generated working with academic and research not-for-profit institutes. We do our bit of pro-bono by working with these institutions at subsidized rates.
Horizon Databook provides a detailed overview of country-level data and insights on the South Africa non-alcoholic beverages market , including forecasts for subscribers. This country databook contains high-level insights into South Africa non-alcoholic beverages market from 2021 to 2033, including revenue numbers, major trends, and company profiles.
Partial client list
South Africa non-alcoholic beverages market size, by product, 2021-2033 (US$M)

South Africa Non-alcoholic Beverages Market Outlook Share, 2025 & 2033 (US$M)


Related statistics
Sign up - it's easy, and free!
Sign up and get instant basic access to databook, upgrade
when ready, or enjoy our
free plan indefinitely.
Included in Horizon account
- 30K+ Global Market Reports
- 120K+ Country Reports
- 1.2M+ Market Statistics
- 200K+ Company Profiles
- Industry insights and more