South Africa Nematicides Market Size & Outlook, 2021-2030
Related Markets
South Africa nematicides market highlights
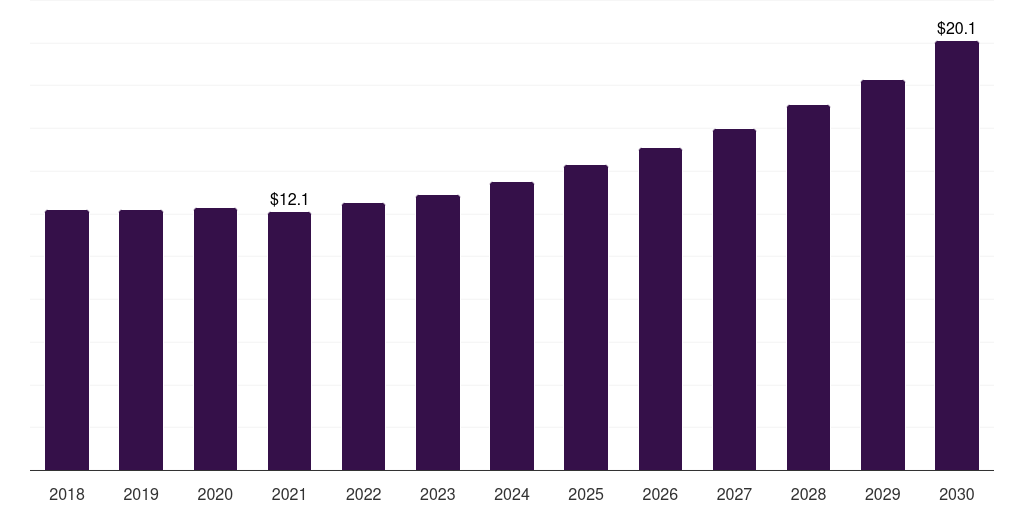
- The South Africa nematicides market generated a revenue of USD 12.1 million in 2021 and is expected to reach USD 20.1 million by 2030.
- The South Africa market is expected to grow at a CAGR of 5.8% from 2022 to 2030.
- In terms of segment, mineral oil nematicides was the largest revenue generating product in 2021.
- Bio-Based Nematicides is the most lucrative product segment registering the fastest growth during the forecast period.
Nematicides market data book summary
| Market revenue in 2021 | USD 12.1 million |
| Market revenue in 2030 | USD 20.1 million |
| Growth rate | 5.8% (CAGR from 2021 to 2030) |
| Largest segment | Mineral oil nematicides |
| Fastest growing segment | Bio-Based Nematicides |
| Historical data | 2018 - 2020 |
| Base year | 2021 |
| Forecast period | 2022 - 2030 |
| Quantitative units | Revenue in USD million |
| Market segmentation | Mineral Oil Nematicides, Bio-Based Nematicides |
| Key market players worldwide | FMC Corp, Basf SE, Sumitomo Chemical Co Ltd, Dow Inc, Bayer AG, Bayer CropScience, ADAMA Agricultural Solutions, Syngenta |
Other key industry trends
- In terms of revenue, South Africa accounted for 1.1% of the global nematicides market in 2021.
- Country-wise, U.S. is expected to lead the global market in terms of revenue in 2030.
- In Middle East & Africa, South Africa nematicides market is projected to lead the regional market in terms of revenue in 2030.
- Saudi Arabia is the fastest growing regional market in Middle East & Africa and is projected to reach USD 18.0 million by 2030.
No credit card required*
Horizon in a snapshot
- 30K+ Global Market Reports
- 120K+ Country Reports
- 1.2M+ Market Statistics
- 200K+ Company Profiles
- Industry insights and more
Nematicides Market Scope
Nematicides Market Companies
| Name | Profile | # Employees | HQ | Website |
|---|---|---|---|---|
| ADAMA Agricultural Solutions | View profile | 1001-5000 | Tel Aviv, Tel Aviv, Israel, Asia | http://www.adama.com/en |
| Bayer CropScience | View profile | 10001+ | Monheim, Bayern, Germany, Europe | https://www.cropscience.bayer.com/ |
| Syngenta | View profile | 10001+ | Greensboro, North Carolina, United States, North America | https://www.syngenta-us.com |
| Bayer AG | View profile | 99723 | Kaiser-Wilhelm-Allee 1, Leverkusen, NW, Germany, 51368 | https://www.bayer.com |
| Sumitomo Chemical Co Ltd | View profile | 37235 | 27-1, Shinkawa 2-chome, Chuo-ku, Tokyo, Japan, 104-8260 | http://www.sumitomo-chem.co.jp |
| Dow Inc | View profile | 35900 | 2211 H.H. Dow Way, Midland, MI, United States, 48674 | https://www.dow.com |
| FMC Corp | View profile | 6600 | 2929 Walnut Street, Philadelphia, PA, United States, 19104 | https://www.fmc.com |
| Basf SE | View profile | 111855 | Carl-Bosch-Strasse 38, Ludwigshafen am Rhein, Germany, 67056 | https://www.basf.com |
South Africa nematicides market outlook
The databook is designed to serve as a comprehensive guide to navigating this sector. The databook focuses on market statistics denoted in the form of revenue and y-o-y growth and CAGR across the globe and regions. A detailed competitive and opportunity analyses related to nematicides market will help companies and investors design strategic landscapes.
Mineral oil nematicides was the largest segment with a revenue share of 65.29% in 2021. Horizon Databook has segmented the South Africa nematicides market based on mineral oil nematicides, bio-based nematicides covering the revenue growth of each sub-segment from 2018 to 2030.
Reasons to subscribe to South Africa nematicides market databook:
-
Access to comprehensive data: Horizon Databook provides over 1 million market statistics and 20,000+ reports, offering extensive coverage across various industries and regions.
-
Informed decision making: Subscribers gain insights into market trends, customer preferences, and competitor strategies, empowering informed business decisions.
-
Cost-Effective solution: It's recognized as the world's most cost-effective market research database, offering high ROI through its vast repository of data and reports.
-
Customizable reports: Tailored reports and analytics allow companies to drill down into specific markets, demographics, or product segments, adapting to unique business needs.
-
Strategic advantage: By staying updated with the latest market intelligence, companies can stay ahead of competitors, anticipate industry shifts, and capitalize on emerging opportunities.
Target buyers of South Africa nematicides market databook
-
Our clientele includes a mix of nematicides market companies, investment firms, advisory firms & academic institutions.
-
30% of our revenue is generated working with investment firms and helping them identify viable opportunity areas.
-
Approximately 65% of our revenue is generated working with competitive intelligence & market intelligence teams of market participants (manufacturers, service providers, etc.).
-
The rest of the revenue is generated working with academic and research not-for-profit institutes. We do our bit of pro-bono by working with these institutions at subsidized rates.
Horizon Databook provides a detailed overview of country-level data and insights on the South Africa nematicides market , including forecasts for subscribers. This country databook contains high-level insights into South Africa nematicides market from 2018 to 2030, including revenue numbers, major trends, and company profiles.
Partial client list
South Africa nematicides market size, by product, 2018-2030 (US$M)

South Africa Nematicides Market Outlook Share, 2021 & 2030 (US$M)


Related statistics
Sign up - it's easy, and free!
Sign up and get instant basic access to databook, upgrade
when ready, or enjoy our
free plan indefinitely.
Included in Horizon account
- 30K+ Global Market Reports
- 120K+ Country Reports
- 1.2M+ Market Statistics
- 200K+ Company Profiles
- Industry insights and more