Asia Pacific Nanomaterials Market Size & Outlook, 2026-2033
Related Markets
Asia Pacific nanomaterials market highlights
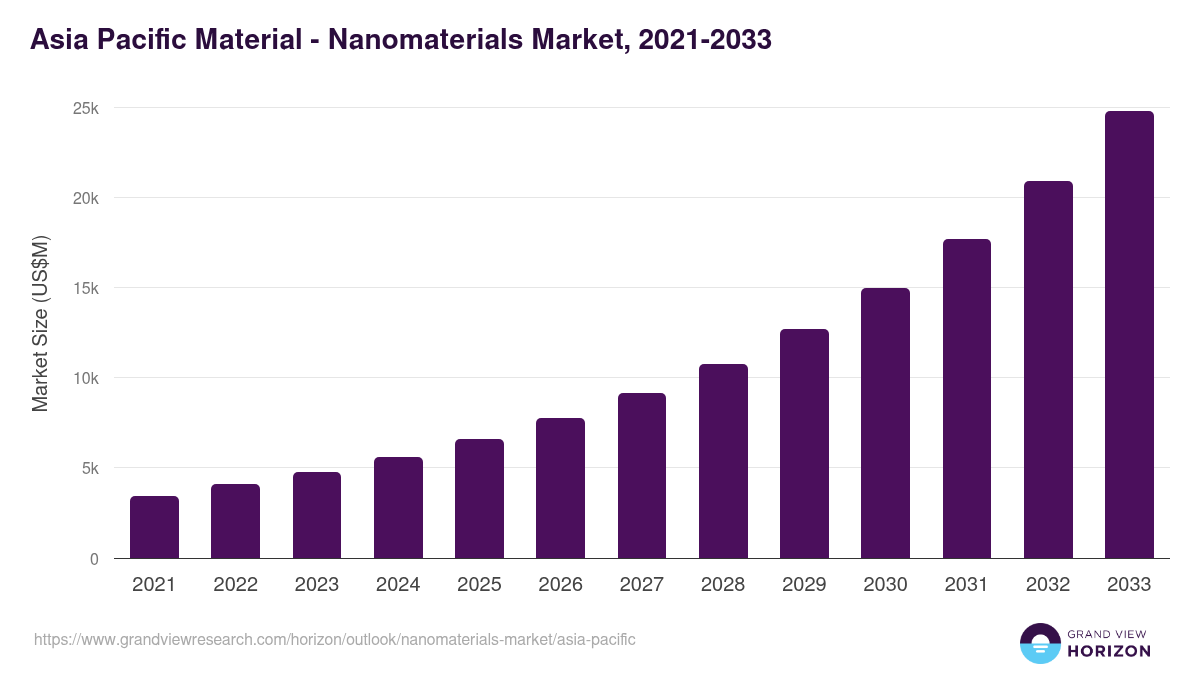
- The Asia Pacific nanomaterials market generated a revenue of USD 6,597.7 million in 2025.
- The market is expected to grow at a CAGR of 18% from 2026 to 2033.
- In terms of segment, ti (titanium) was the largest revenue generating material in 2025.
- Ti (Titanium) is the most lucrative material segment registering the fastest growth during the forecast period.
- Country-wise, India is expected to register the highest CAGR from 2026 to 2033.
Asia Pacific data book summary
| Market revenue in 2025 | USD 6,597.7 million |
| Market revenue in 2033 | USD 24,762.4 million |
| Growth rate | 18% (CAGR from 2026 to 2033) |
| Largest segment | Ti (titanium) |
| Fastest growing segment | Ti (Titanium) |
| Historical data covered | 2021 - 2024 |
| Base year for estimation | 2025 |
| Forecast period covered | 2026 - 2033 |
| Quantitative units | Revenue in USD million |
| Market segmentation | Au (Gold), Ag (Silver), Fe (Iron), Cu (Copper), Pt (Platinum), Ti (Titanium), Ni (Nickel), Aluminum Oxide, Antimony Tin Oxide, Bismuth Oxide, Carbon Nanotubes |
| Key market players worldwide | Air Products & Chemicals Inc, Nanoco Group PLC, Frontier Group Holdings Inc, Nanophase Technologies Corp, Cytokinetics Inc, Quantum Corp |
Other key industry trends
- In terms of revenue, Asia Pacific region accounted for 40.6% of the global nanomaterials market in 2025.
- Globally, Asia Pacific is projected to lead the regional market in terms of revenue in 2033.
- Asia Pacific is the fastest growing regional market and is projected to reach USD 24,762.4 million by 2033.
No credit card required*
Horizon in a snapshot
- 30K+ Global Market Reports
- 120K+ Country Reports
- 1.2M+ Market Statistics
- 200K+ Company Profiles
- Industry insights and more
Nanomaterials Market Scope
Nanomaterials Market Companies
| Name | Profile | # Employees | HQ | Website |
|---|---|---|---|---|
| Quantum Corp | View profile | 850 | 224 Airport Parkway, Suite 550, San Jose, CA, United States, 95110 | https://www.quantum.com |
| Nanophase Technologies Corp | View profile | 79 | 1319 Marquette Drive, Romeoville, IL, United States, 60446 | https://www.nanophase.com |
| Frontier Group Holdings Inc | View profile | 7675 | 4545 Airport Way, Denver, CO, United States, 80239 | https://www.flyfrontier.com |
| Nanoco Group PLC | View profile | 37 | The Heath Business & Technical Park, Heath Road South, Science Centre, Runcorn, United Kingdom, WA7 4QE | http://www.nanocotechnologies.com |
| Cytokinetics Inc | View profile | 564 | 350 Oyster Point Boulevard, South San Francisco, CA, United States, 94080 | https://www.cytokinetics.com |
| Air Products & Chemicals Inc | View profile | 23000 | 1940 Air Products Boulevard, Allentown, PA, United States, 18106-5500 | https://www.airproducts.com |
Asia Pacific nanomaterials market outlook
The databook is designed to serve as a comprehensive guide to navigating this sector. The databook focuses on market statistics denoted in the form of revenue and y-o-y growth and CAGR across the globe and regions. A detailed competitive and opportunity analyses related to nanomaterials market will help companies and investors design strategic landscapes.
Ti (titanium) was the largest segment with a revenue share of 29.07% in 2025. Horizon Databook has segmented the Asia Pacific nanomaterials market based on au (gold), ag (silver), fe (iron), cu (copper), pt (platinum), ti (titanium), ni (nickel), aluminum oxide, antimony tin oxide, bismuth oxide, carbon nanotubes covering the revenue growth of each sub-segment from 2021 to 2033.
The substantial growth of electronics, medical equipment, aerospace & defense, textiles, and automotive industries in Asia Pacific is expected to fuel the demand for nanomaterials in the region. Several multinational companies are investing in the nanomaterials market.
A leading developer and manufacturer of proprietary advanced materials hybridized at the nanoscale, entered a strategic partnership to commercialize novel nanomaterials to benefit various market segments including high-performance tires, conductive plastics, novel coatings, and next generation batteries. Such investments are propelling the growth of the nanomaterials market in the region.
Rising product demand from microelectronics and nanoelectronics on account of increasing usage of advanced devices is anticipated to augment the market growth. Key players in the electronics industry including Intel, Siltronic AG, and Qualcomm are investing heavily in research & development activities related to nanoelectronics and their application in various electronic devices.
Reasons to subscribe to Asia Pacific nanomaterials market databook:
-
Access to comprehensive data: Horizon Databook provides over 1 million market statistics and 20,000+ reports, offering extensive coverage across various industries and regions.
-
Informed decision making: Subscribers gain insights into market trends, customer preferences, and competitor strategies, empowering informed business decisions.
-
Cost-Effective solution: It's recognized as the world's most cost-effective market research database, offering high ROI through its vast repository of data and reports.
-
Customizable reports: Tailored reports and analytics allow companies to drill down into specific markets, demographics, or product segments, adapting to unique business needs.
-
Strategic advantage: By staying updated with the latest market intelligence, companies can stay ahead of competitors, anticipate industry shifts, and capitalize on emerging opportunities.
Target buyers of Asia Pacific nanomaterials market databook
-
Our clientele includes a mix of nanomaterials market companies, investment firms, advisory firms & academic institutions.
-
30% of our revenue is generated working with investment firms and helping them identify viable opportunity areas.
-
Approximately 65% of our revenue is generated working with competitive intelligence & market intelligence teams of market participants (manufacturers, service providers, etc.).
-
The rest of the revenue is generated working with academic and research not-for-profit institutes. We do our bit of pro-bono by working with these institutions at subsidized rates.
Horizon Databook provides a detailed overview of continent-level data and insights on the Asia Pacific nanomaterials market , including forecasts for subscribers. This continent databook contains high-level insights into Asia Pacific nanomaterials market from 2021 to 2033, including revenue numbers, major trends, and company profiles.
Partial client list
Asia Pacific nanomaterials market size, by country, 2021-2033 (US$M)

Asia Pacific Nanomaterials Market Outlook Share, 2025 & 2033 (US$M)


Related industry reports
Related statistics
Sign up - it's easy, and free!
Sign up and get instant basic access to databook, upgrade
when ready, or enjoy our
free plan indefinitely.
Included in Horizon account
- 30K+ Global Market Reports
- 120K+ Country Reports
- 1.2M+ Market Statistics
- 200K+ Company Profiles
- Industry insights and more