U.S. Low-code Development Platform Market Size & Outlook
Related Markets
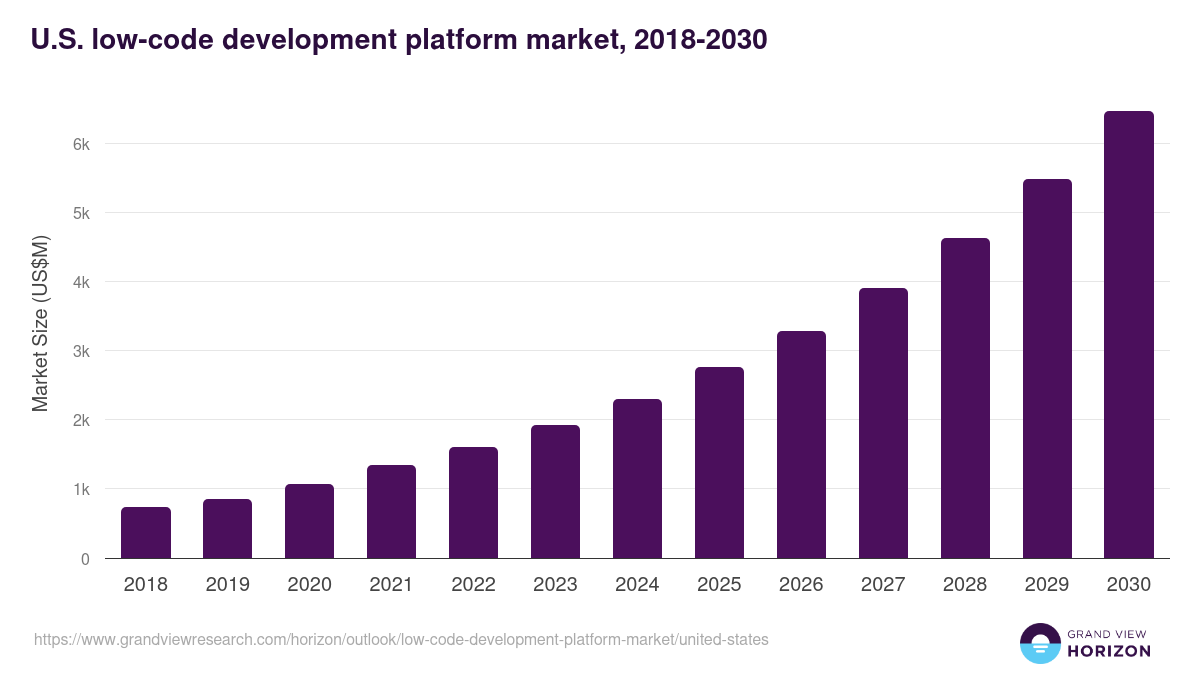
U.S. low-code development platform market highlights
- The U.S. low-code development platform market generated a revenue of USD 1,611.5 million in 2022 and is expected to reach USD 6,460.9 million by 2030.
- The U.S. market is expected to grow at a CAGR of 19% from 2023 to 2030.
- In terms of segment, web based was the largest revenue generating application in 2022.
- Mobile based is the most lucrative application segment registering the fastest growth during the forecast period.
Low-code development platform market data book summary
| Market revenue in 2022 | USD 1,611.5 million |
| Market revenue in 2030 | USD 6,460.9 million |
| Growth rate | 19% (CAGR from 2022 to 2030) |
| Largest segment | Web based |
| Fastest growing segment | Mobile based |
| Historical data | 2018 - 2021 |
| Base year | 2022 |
| Forecast period | 2023 - 2030 |
| Quantitative units | Revenue in USD million |
| Market segmentation | Web based, Mobile based |
| Key market players worldwide | Microsoft Corp, Oracle Corp, Pegasystems Inc, Salesforce Inc, ServiceNow Inc, Tyler Technologies Inc, Appian Corp A, Fujitsu Ltd, Siemens AG, Betty Blocks, LANSA, Nintex, OutSystems, TrackVia, Zoho |
Other key industry trends
- In terms of revenue, U.S. accounted for 23.8% of the global low-code development platform market in 2022.
- Country-wise, U.S. is expected to lead the global market in terms of revenue in 2030.
- In North America, U.S. low-code development platform market is projected to lead the regional market in terms of revenue in 2030.
- Canada is the fastest growing regional market in North America and is projected to reach USD 2,820.2 million by 2030.
No credit card required*
Horizon in a snapshot
- 30K+ Global Market Reports
- 120K+ Country Reports
- 1.2M+ Market Statistics
- 200K+ Company Profiles
- Industry insights and more
Low-code Development Platform Market Scope
Low-code Development Platform Market Companies
| Name | Profile | # Employees | HQ | Website |
|---|---|---|---|---|
| LANSA | View profile | 101-250 | Downers Grove, Illinois, United States, North America | http://www.lansa.com |
| TrackVia | View profile | 51-100 | Denver, Colorado, United States, North America | https://www.trackvia.com |
| OutSystems | View profile | 1001-5000 | Boston, Massachusetts, United States, North America | https://www.outsystems.com |
| Betty Blocks | View profile | 101-250 | Alkmaar, Noord-Holland, The Netherlands, Europe | http://www.bettyblocks.com |
| Nintex | View profile | 251-500 | Bellevue, Washington, United States, North America | https://www.nintex.com/ |
| Zoho | View profile | 10001+ | Pleasanton, California, United States, North America | https://www.zoho.com |
| Tyler Technologies Inc | View profile | 7305 | 5101 Tennyson Parkway, Plano, TX, United States, 75024 | https://www.tylertech.com |
| Salesforce Inc | View profile | 72682 | 415 Mission Street, 3rd Floor, Salesforce Tower, San Francisco, CA, United States, 94105 | https://www.salesforce.com |
| Pegasystems Inc | View profile | 5406 | One Main Street, Cambridge, MA, United States, 02142 | https://www.pega.com |
| ServiceNow Inc | View profile | 22668 | 2225 Lawson Lane, Santa Clara, CA, United States, 95054 | https://www.servicenow.com |
| Appian Corp A | View profile | 2243 | 7950 Jones Branch Drive, McLean, VA, United States, 22102 | https://www.appian.com |
| Siemens AG | View profile | 321000 | Werner-von-Siemens-Strabe 1, Munich, BY, Germany, 80333 | https://www.siemens.com |
| Microsoft Corp | View profile | 221000 | One Microsoft Way, Redmond, WA, United States, 98052-6399 | https://www.microsoft.com |
| Fujitsu Ltd | View profile | 124055 | Shiodome City Center, 1-5-2 Higashi-Shimbashi, Minato-ku, Tokyo, Japan, 105-7123 | http://www.fujitsu.com |
| Oracle Corp | View profile | 164000 | 2300 Oracle Way, Austin, TX, United States, 78741 | https://www.oracle.com |
U.S. low-code development platform market outlook
The databook is designed to serve as a comprehensive guide to navigating this sector. The databook focuses on market statistics denoted in the form of revenue and y-o-y growth and CAGR across the globe and regions. A detailed competitive and opportunity analyses related to low-code development platform market will help companies and investors design strategic landscapes.
Web based was the largest segment with a revenue share of 67.34% in 2022. Horizon Databook has segmented the U.S. low-code development platform market based on web based, mobile based covering the revenue growth of each sub-segment from 2018 to 2030.
- U.S. Low-code Development Platform Application Outlook (Revenue, USD Million, 2018-2030)
- Web based
- Mobile based
- U.S. Low-code Development Platform Deployment Type Outlook (Revenue, USD Million, 2018-2030)
- On Premise
- Cloud
- U.S. Low-code Development Platform Organization Size Outlook (Revenue, USD Million, 2018-2030)
- SME
- Large Enterprise
- U.S. Low-code Development Platform End Use Outlook (Revenue, USD Million, 2018-2030)
- Retail
- Others
- Automotive & Manufacturing
- Education
- Transportation & Logistics
- BFSI
- IT & Telecom
Reasons to subscribe to U.S. low-code development platform market databook:
-
Access to comprehensive data: Horizon Databook provides over 1 million market statistics and 20,000+ reports, offering extensive coverage across various industries and regions.
-
Informed decision making: Subscribers gain insights into market trends, customer preferences, and competitor strategies, empowering informed business decisions.
-
Cost-Effective solution: It's recognized as the world's most cost-effective market research database, offering high ROI through its vast repository of data and reports.
-
Customizable reports: Tailored reports and analytics allow companies to drill down into specific markets, demographics, or product segments, adapting to unique business needs.
-
Strategic advantage: By staying updated with the latest market intelligence, companies can stay ahead of competitors, anticipate industry shifts, and capitalize on emerging opportunities.
Target buyers of U.S. low-code development platform market databook
-
Our clientele includes a mix of low-code development platform market companies, investment firms, advisory firms & academic institutions.
-
30% of our revenue is generated working with investment firms and helping them identify viable opportunity areas.
-
Approximately 65% of our revenue is generated working with competitive intelligence & market intelligence teams of market participants (manufacturers, service providers, etc.).
-
The rest of the revenue is generated working with academic and research not-for-profit institutes. We do our bit of pro-bono by working with these institutions at subsidized rates.
Horizon Databook provides a detailed overview of country-level data and insights on the U.S. low-code development platform market , including forecasts for subscribers. This country databook contains high-level insights into U.S. low-code development platform market from 2018 to 2030, including revenue numbers, major trends, and company profiles.
Partial client list
U.S. low-code development platform market size, by application, 2018-2030 (US$M)

U.S. Low-code Development Platform Market Outlook Share, 2022 & 2030 (US$M)


Related industry reports
Related statistics
Sign up - it's easy, and free!
Sign up and get instant basic access to databook, upgrade
when ready, or enjoy our
free plan indefinitely.
Included in Horizon account
- 30K+ Global Market Reports
- 120K+ Country Reports
- 1.2M+ Market Statistics
- 200K+ Company Profiles
- Industry insights and more