Asia Pacific In-camera Visual Effects Market Size & Outlook
Related Markets
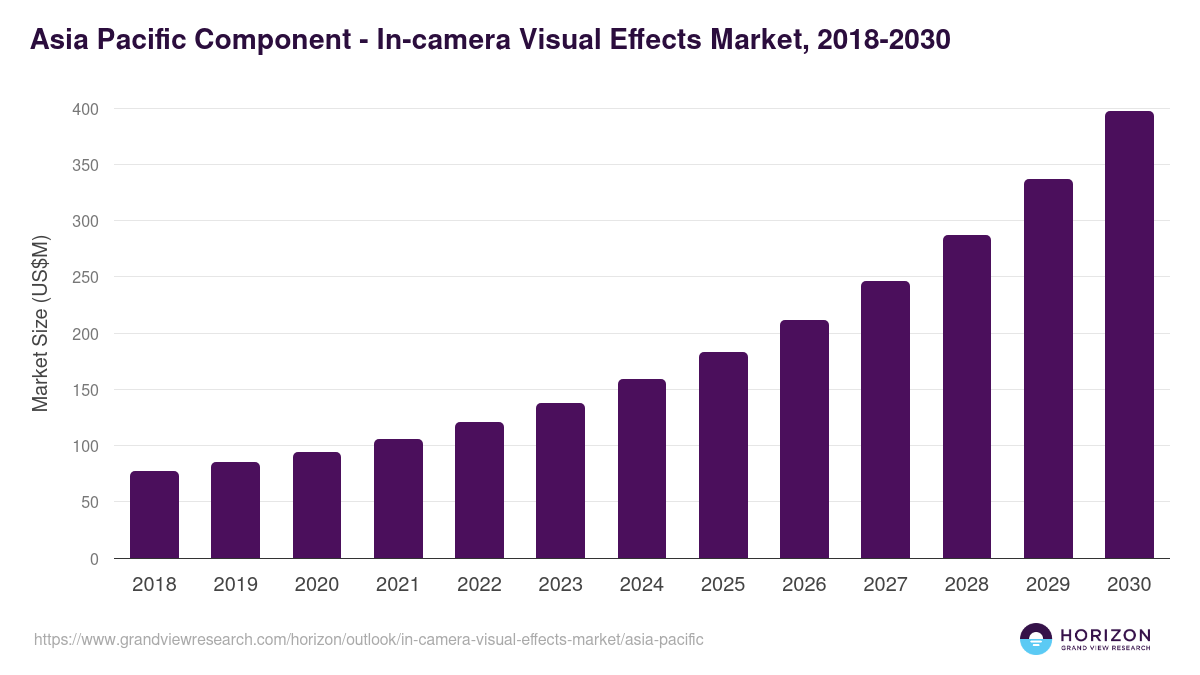
Asia Pacific in-camera visual effects market highlights
- The Asia Pacific in-camera visual effects market generated a revenue of USD 158.8 million in 2024.
- The market is expected to grow at a CAGR of 16.8% from 2025 to 2030.
- In terms of segment, hardware was the largest revenue generating component in 2024.
- Software is the most lucrative component segment registering the fastest growth during the forecast period.
- Country-wise, India is expected to register the highest CAGR from 2025 to 2030.
Asia Pacific data book summary
| Market revenue in 2024 | USD 158.8 million |
| Market revenue in 2030 | USD 397.1 million |
| Growth rate | 16.8% (CAGR from 2025 to 2030) |
| Largest segment | Hardware |
| Fastest growing segment | Software |
| Historical data covered | 2018 - 2023 |
| Base year for estimation | 2024 |
| Forecast period covered | 2025 - 2030 |
| Quantitative units | Revenue in USD million |
| Market segmentation | Hardware, Software, Services |
Other key industry trends
- In terms of revenue, Asia Pacific region accounted for 23.9% of the global in-camera visual effects market in 2024.
- Globally, North America is projected to lead the regional market in terms of revenue in 2030.
- Asia Pacific is the fastest growing regional market and is projected to reach USD 397.1 million by 2030.
No credit card required*
Horizon in a snapshot
- 30K+ Global Market Reports
- 120K+ Country Reports
- 1.2M+ Market Statistics
- 200K+ Company Profiles
- Industry insights and more
In-Camera Visual Effects Market Scope
In-Camera Visual Effects Market Companies
| Name | Profile | # Employees | HQ | Website |
|---|---|---|---|---|
| Megapixel | View profile | 11-50 | Praha, Hlavni mesto Praha, Czech Republic, Europe | https://www.megapixel.cz/ |
| Mo-Sys Engineering | View profile | 11-50 | London, England, United Kingdom, Europe | http://www.mo-sys.com |
| NantStudio | View profile | 1-10 | Culver City, California, United States, North America | http://nantstudio.com/ |
| Moving Picture Company | View profile | 1001-5000 | Santa Monica, California, United States, North America | http://www.moving-picture.com/ |
| NEP Group | View profile | 5001-10000 | Pittsburgh, Pennsylvania, United States, North America | https://www.nepgroup.com/ |
| Dimensions | View profile | - | London, England, United Kingdom, Europe | https://www.dimensions.cx/ |
| PIXOMONDO | View profile | 501-1000 | Frankfurt, Hessen, Germany, Europe | http://www.pixomondo.com/ |
| Framestore | View profile | 501-1000 | London, England, United Kingdom, Europe | https://www.framestore.com |
| Weta Digital | View profile | 501-1000 | Wellington, Wellington, New Zealand, Oceania | https://www.wetafx.co.nz/ |
| DNEG | View profile | 1001-5000 | London, England, United Kingdom, Europe | http://www.dneg.com |
| Industrial Light + Magic (Lucasfilm) | View profile | 501-1000 | San Francisco, California, United States, North America | http://ilm.com/ |
| Epic Games | View profile | 1001-5000 | Cary, North Carolina, United States, North America | https://store.epicgames.com |
| Sony Corporation | View profile | - | - | - |
| ROE Visual | View profile | 251-500 | Chatsworth, California, United States, North America | https://www.roevisual.com/en/ |
| Samsung Electronics Co Ltd | View profile | 124804 | 129, Samsung-ro, Yeongtong-gu, Gyeonggi-do, Suwon-si, Korea, Republic of, 443-742 | https://www.samsung.com |
Asia Pacific in-camera visual effects market outlook
The databook is designed to serve as a comprehensive guide to navigating this sector. The databook focuses on market statistics denoted in the form of revenue and y-o-y growth and CAGR across the globe and regions. A detailed competitive and opportunity analyses related to in-camera visual effects market will help companies and investors design strategic landscapes.
Hardware was the largest segment with a revenue share of 57.05% in 2024. Horizon Databook has segmented the Asia Pacific in-camera visual effects market based on hardware, software, services covering the revenue growth of each sub-segment from 2018 to 2030.
Reasons to subscribe to Asia Pacific in-camera visual effects market databook:
-
Access to comprehensive data: Horizon Databook provides over 1 million market statistics and 20,000+ reports, offering extensive coverage across various industries and regions.
-
Informed decision making: Subscribers gain insights into market trends, customer preferences, and competitor strategies, empowering informed business decisions.
-
Cost-Effective solution: It's recognized as the world's most cost-effective market research database, offering high ROI through its vast repository of data and reports.
-
Customizable reports: Tailored reports and analytics allow companies to drill down into specific markets, demographics, or product segments, adapting to unique business needs.
-
Strategic advantage: By staying updated with the latest market intelligence, companies can stay ahead of competitors, anticipate industry shifts, and capitalize on emerging opportunities.
Target buyers of Asia Pacific in-camera visual effects market databook
-
Our clientele includes a mix of in-camera visual effects market companies, investment firms, advisory firms & academic institutions.
-
30% of our revenue is generated working with investment firms and helping them identify viable opportunity areas.
-
Approximately 65% of our revenue is generated working with competitive intelligence & market intelligence teams of market participants (manufacturers, service providers, etc.).
-
The rest of the revenue is generated working with academic and research not-for-profit institutes. We do our bit of pro-bono by working with these institutions at subsidized rates.
Horizon Databook provides a detailed overview of continent-level data and insights on the Asia Pacific in-camera visual effects market , including forecasts for subscribers. This continent databook contains high-level insights into Asia Pacific in-camera visual effects market from 2018 to 2030, including revenue numbers, major trends, and company profiles.
Partial client list
Asia Pacific in-camera visual effects market size, by country, 2018-2030 (US$M)

Asia Pacific In-Camera Visual Effects Market Outlook Share, 2024 & 2030 (US$M)


Related industry reports
Related statistics
Sign up - it's easy, and free!
Sign up and get instant basic access to databook, upgrade
when ready, or enjoy our
free plan indefinitely.
Included in Horizon account
- 30K+ Global Market Reports
- 120K+ Country Reports
- 1.2M+ Market Statistics
- 200K+ Company Profiles
- Industry insights and more