U.S. Image-guided Therapy Systems Market Size & Outlook
Related Markets
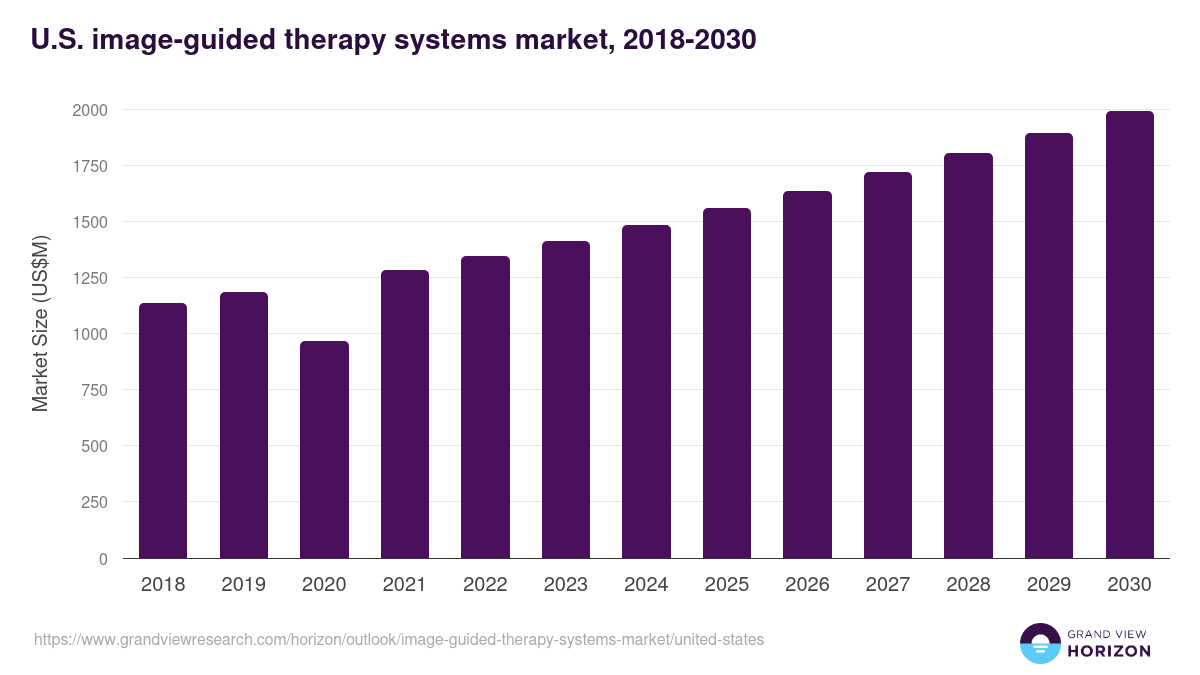
U.S. image-guided therapy systems market highlights
- The U.S. image-guided therapy systems market generated a revenue of USD 1,486.6 million in 2024 and is expected to reach USD 1,993.4 million by 2030.
- The U.S. market is expected to grow at a CAGR of 5% from 2025 to 2030.
- In terms of segment, endoscopes was the largest revenue generating product in 2024.
- Single Photon Emission Computed Tomography (SPECT) is the most lucrative product segment registering the fastest growth during the forecast period.
Image-guided therapy systems market data book summary
| Market revenue in 2024 | USD 1,486.6 million |
| Market revenue in 2030 | USD 1,993.4 million |
| Growth rate | 5% (CAGR from 2025 to 2030) |
| Largest segment | Endoscopes |
| Fastest growing segment | Single Photon Emission Computed Tomography (SPECT) |
| Historical data | 2018 - 2023 |
| Base year | 2024 |
| Forecast period | 2025 - 2030 |
| Quantitative units | Revenue in USD million |
| Market segmentation | Computed Tomography (CT) Scanners, Ultrasound Systems, Magnetic Resonance Imaging (MRI), Endoscopes, X-ray Fluoroscopy, Positron Emission Tomography (PET), Single Photon Emission Computed Tomography (SPECT) |
| Key market players worldwide | Koninklijke Philips NV, Medtronic PLC, Siemens Healthineers AG ADR, Analogic Corporation, GE HealthCare Technologies Inc Common Stock, BrainLAB, Olympus Corp, Stryker Corp, Varian |
Other key industry trends
- In terms of revenue, U.S. accounted for 29.0% of the global image-guided therapy systems market in 2024.
- Country-wise, U.S. is expected to lead the global market in terms of revenue in 2030.
- In North America, U.S. image-guided therapy systems market is projected to lead the regional market in terms of revenue in 2030.
- U.S. is the fastest growing regional market in North America and is projected to reach USD 1,993.4 million by 2030.
No credit card required*
Horizon in a snapshot
- 30K+ Global Market Reports
- 120K+ Country Reports
- 1.2M+ Market Statistics
- 200K+ Company Profiles
- Industry insights and more
Image-guided Therapy Systems Market Scope
Image-guided Therapy Systems Market Companies
| Name | Profile | # Employees | HQ | Website |
|---|---|---|---|---|
| Varian | View profile | 5001-10000 | Palo Alto, California, United States, North America | http://www.varian.com/ |
| BrainLAB | View profile | 1001-5000 | Munich, Bayern, Germany, Europe | http://www.brainlab.com |
| Analogic Corporation | View profile | 1001-5000 | Peabody, Massachusetts, United States, North America | https://www.analogic.com |
| Olympus Corp | View profile | 33629 | Shinjuku Monolith, 2-3-1 Nishi-Shinjuku, Shinjuku-ku, Tokyo, Japan, 163-0914 | http://www.olympus.co.jp |
| Siemens Healthineers AG ADR | View profile | 71400 | Siemensstr. 3, Forchheim, BY, Germany, 91301 | https://www.siemens-healthineers.com |
| Stryker Corp | View profile | 52000 | 1941 Stryker Way, Portage, MI, United States, 49002 | https://www.stryker.com |
| Medtronic PLC | View profile | 95000 | Lower Hatch Street, 20 On Hatch, Dublin, Ireland, 2 | https://www.medtronic.com |
| Koninklijke Philips NV | View profile | 73712 | Philips Center, Amstelplein 2, Amsterdam, Netherlands, 1096 BC | https://www.philips.com |
| GE HealthCare Technologies Inc Common Stock | View profile | 51000 | 500 West Monroe Street, Chicago, IL, United States, 60661 | https://www.gehealthcare.com |
U.S. image-guided therapy systems market outlook
The databook is designed to serve as a comprehensive guide to navigating this sector. The databook focuses on market statistics denoted in the form of revenue and y-o-y growth and CAGR across the globe and regions. A detailed competitive and opportunity analyses related to image-guided therapy systems market will help companies and investors design strategic landscapes.
Endoscopes was the largest segment with a revenue share of 36.68% in 2024. Horizon Databook has segmented the U.S. image-guided therapy systems market based on computed tomography (ct) scanners, ultrasound systems, magnetic resonance imaging (mri), endoscopes, x-ray fluoroscopy, positron emission tomography (pet), single photon emission computed tomography (spect) covering the revenue growth of each sub-segment from 2018 to 2030.
According to estimates by the Population Reference Bureau, the U.S. geriatric population is anticipated to increase from 46 million in 2016 to nearly 98 million by 2060. Hypertension, arthritis, and diabetes were highly prevalent in 2017, according to CVS Health.
Thus, increase in the usage of image-guided therapy systems for cardiac, orthopedic, or neurological interventions to address the chronic disease burden is likely to drive the U.S. market.
Favorable initiatives, such as the Image-guided Therapy Program by Brigham and Women's Hospital, can help combine advancements in therapy and imaging for development of minimally invasive interventional & surgical techniques, which is expected to boost the market.
Reasons to subscribe to U.S. image-guided therapy systems market databook:
-
Access to comprehensive data: Horizon Databook provides over 1 million market statistics and 20,000+ reports, offering extensive coverage across various industries and regions.
-
Informed decision making: Subscribers gain insights into market trends, customer preferences, and competitor strategies, empowering informed business decisions.
-
Cost-Effective solution: It's recognized as the world's most cost-effective market research database, offering high ROI through its vast repository of data and reports.
-
Customizable reports: Tailored reports and analytics allow companies to drill down into specific markets, demographics, or product segments, adapting to unique business needs.
-
Strategic advantage: By staying updated with the latest market intelligence, companies can stay ahead of competitors, anticipate industry shifts, and capitalize on emerging opportunities.
Target buyers of U.S. image-guided therapy systems market databook
-
Our clientele includes a mix of image-guided therapy systems market companies, investment firms, advisory firms & academic institutions.
-
30% of our revenue is generated working with investment firms and helping them identify viable opportunity areas.
-
Approximately 65% of our revenue is generated working with competitive intelligence & market intelligence teams of market participants (manufacturers, service providers, etc.).
-
The rest of the revenue is generated working with academic and research not-for-profit institutes. We do our bit of pro-bono by working with these institutions at subsidized rates.
Horizon Databook provides a detailed overview of country-level data and insights on the U.S. image-guided therapy systems market , including forecasts for subscribers. This country databook contains high-level insights into U.S. image-guided therapy systems market from 2018 to 2030, including revenue numbers, major trends, and company profiles.
Partial client list
U.S. image-guided therapy systems market size, by product, 2018-2030 (US$M)

U.S. Image-guided Therapy Systems Market Outlook Share, 2024 & 2030 (US$M)


Related industry reports
Related statistics
Sign up - it's easy, and free!
Sign up and get instant basic access to databook, upgrade
when ready, or enjoy our
free plan indefinitely.
Included in Horizon account
- 30K+ Global Market Reports
- 120K+ Country Reports
- 1.2M+ Market Statistics
- 200K+ Company Profiles
- Industry insights and more