North America Gene Expression Market Size & Outlook
Related Markets
North America gene expression market highlights
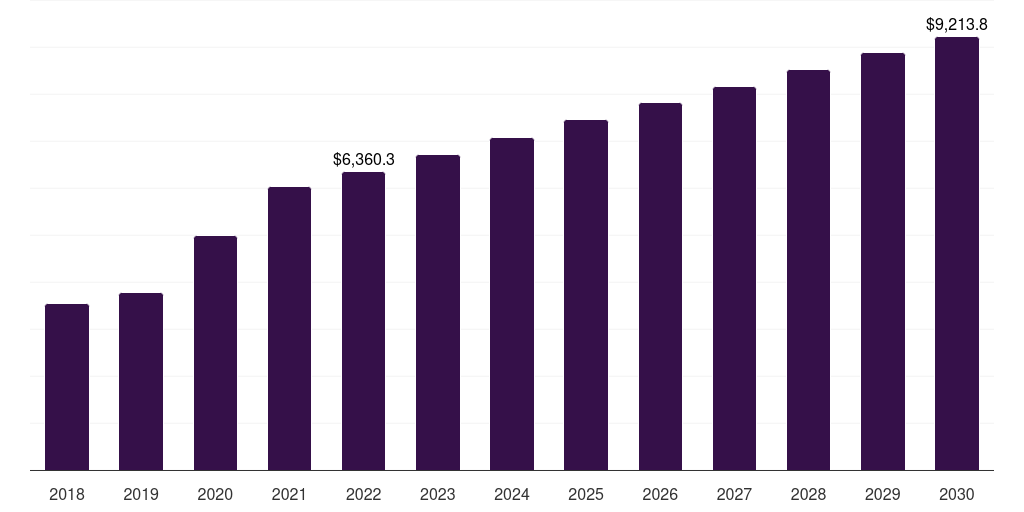
- The North America gene expression market generated a revenue of USD 6,360.3 million in 2022.
- The market is expected to grow at a CAGR of 4.7% from 2023 to 2030.
- In terms of segment, cdna synthesis & conversion was the largest revenue generating process in 2022.
- Data Analysis & Interpretation is the most lucrative process segment registering the fastest growth during the forecast period.
- Country-wise, U.S. is expected to register the highest CAGR from 2023 to 2030.
North America data book summary
| Market revenue in 2022 | USD 6,360.3 million |
| Market revenue in 2030 | USD 9,213.8 million |
| Growth rate | 4.7% (CAGR from 2022 to 2030) |
| Largest segment | Cdna synthesis & conversion |
| Fastest growing segment | Data Analysis & Interpretation |
| Historical data covered | 2018 - 2021 |
| Base year for estimation | 2022 |
| Forecast period covered | 2023 - 2030 |
| Quantitative units | Revenue in USD million |
| Market segmentation | Sample Collection, Purification, CDNA Synthesis & Conversion, PCR Analysis, Data Analysis & Interpretation |
| Key market players worldwide | Catalent Inc, Qiagen NV, Quest Diagnostics Inc, Roche, Illumina Inc, PerkinElmer, Bio-Rad Laboratories Inc Class A, Thermo Fisher Scientific Inc, Agilent Technologies, GE HealthCare Technologies Inc Common Stock, Promega, Luminex, Takara Bio Inc, Danaher Corp |
Other key industry trends
- In terms of revenue, North America region accounted for 45.5% of the global gene expression market in 2022.
- Globally, North America is projected to lead the regional market in terms of revenue in 2030.
- Asia Pacific is the fastest growing regional market and is projected to reach USD 5,754.4 million by 2030.
No credit card required*
Horizon in a snapshot
- 30K+ Global Market Reports
- 120K+ Country Reports
- 1.2M+ Market Statistics
- 200K+ Company Profiles
- Industry insights and more
Gene Expression Market Scope
Gene Expression Market Companies
| Name | Profile | # Employees | HQ | Website |
|---|---|---|---|---|
| Bio-Rad Laboratories Inc Class A | View profile | 8030 | 1000 Alfred Nobel Drive, Hercules, CA, United States, 94547 | https://www.bio-rad.com |
| Promega | View profile | 5001-10000 | Madison, Wisconsin, United States, North America | http://www.promega.com/es |
| Agilent Technologies | View profile | 10001+ | Santa Clara, California, United States, North America | http://www.agilent.com |
| Luminex | View profile | 501-1000 | Austin, Texas, United States, North America | http://www.luminexcorp.com |
| PerkinElmer | View profile | 10001+ | Waltham, Massachusetts, United States, North America | http://www.perkinelmer.com |
| Roche | View profile | 10001+ | Basel, Basel-Stadt, Switzerland, Europe | http://www.roche.com |
| Catalent Inc | View profile | 17219 | 14 Schoolhouse Road, Somerset, NJ, United States, 08873 | https://www.catalent.com |
| Takara Bio Inc | View profile | 1793 | Nojihigashi 7-4-38 Kusatu, Shiga, Otsu, Japan, 520-0058 | http://www.takara-bio.co.jp |
| Qiagen NV | View profile | 5900 | Hulsterweg 82, Venlo, LI, Netherlands, 5912 PL | https://www.qiagen.com |
| Illumina Inc | View profile | 9300 | 5200 Illumina Way, San Diego, CA, United States, 92122 | https://www.illumina.com |
| Quest Diagnostics Inc | View profile | 48000 | 500 Plaza Drive, Secaucus, NJ, United States, 07094 | https://www.questdiagnostics.com |
| Danaher Corp | View profile | 63000 | 2200 Pennsylvania Avenue, N.W., Suite 800W, Washington, DC, United States, 20037-1701 | https://www.danaher.com |
| Thermo Fisher Scientific Inc | View profile | 122000 | 168 Third Avenue, Waltham, MA, United States, 02451 | https://www.thermofisher.com |
| GE HealthCare Technologies Inc Common Stock | View profile | 51000 | 500 West Monroe Street, Chicago, IL, United States, 60661 | https://www.gehealthcare.com |
North America gene expression market outlook
The databook is designed to serve as a comprehensive guide to navigating this sector. The databook focuses on market statistics denoted in the form of revenue and y-o-y growth and CAGR across the globe and regions. A detailed competitive and opportunity analyses related to gene expression market will help companies and investors design strategic landscapes.
Cdna synthesis & conversion was the largest segment with a revenue share of 27.1% in 2022. Horizon Databook has segmented the North America gene expression market based on sample collection, purification, cdna synthesis & conversion, pcr analysis, data analysis & interpretation covering the revenue growth of each sub-segment from 2018 to 2030.
North America held the highest share in terms of revenue generation in 2017 owing to local presence of key players in the region. Furthermore, increased demand for personalized medicine, high incidence of gene-based diseases, and high private & public investments in genomic research have contributed to revenue generation.
In addition, rapid technological advancements in various fields associated with biotechnology, such as gene therapy, molecular diagnostics, bioinformatics, and sequencings, have increased the scope for application of gene expression.
Emergence of high-throughput sequencing technologies in combination with bioinformatics provides rapid results for gene expression analysis. Hence, researchers are encouraged to adopt gene expression studies for various purposes, such as disease modeling and advanced diagnostics.
Reasons to subscribe to North America gene expression market databook:
-
Access to comprehensive data: Horizon Databook provides over 1 million market statistics and 20,000+ reports, offering extensive coverage across various industries and regions.
-
Informed decision making: Subscribers gain insights into market trends, customer preferences, and competitor strategies, empowering informed business decisions.
-
Cost-Effective solution: It's recognized as the world's most cost-effective market research database, offering high ROI through its vast repository of data and reports.
-
Customizable reports: Tailored reports and analytics allow companies to drill down into specific markets, demographics, or product segments, adapting to unique business needs.
-
Strategic advantage: By staying updated with the latest market intelligence, companies can stay ahead of competitors, anticipate industry shifts, and capitalize on emerging opportunities.
Target buyers of North America gene expression market databook
-
Our clientele includes a mix of gene expression market companies, investment firms, advisory firms & academic institutions.
-
30% of our revenue is generated working with investment firms and helping them identify viable opportunity areas.
-
Approximately 65% of our revenue is generated working with competitive intelligence & market intelligence teams of market participants (manufacturers, service providers, etc.).
-
The rest of the revenue is generated working with academic and research not-for-profit institutes. We do our bit of pro-bono by working with these institutions at subsidized rates.
Horizon Databook provides a detailed overview of continent-level data and insights on the North America gene expression market, including forecasts for subscribers. This continent databook contains high-level insights into North America gene expression market from 2018 to 2030, including revenue numbers, major trends, and company profiles.
Partial client list
North America gene expression analysis market size, by country, 2018-2030 (US$M)

North America Gene Expression Market Share, 2022 & 2030 (US$M)


Related industry reports
Related statistics
Sign up - it's easy, and free!
Sign up and get instant basic access to databook, upgrade
when ready, or enjoy our
free plan indefinitely.
Included in Horizon account
- 30K+ Global Market Reports
- 120K+ Country Reports
- 1.2M+ Market Statistics
- 200K+ Company Profiles
- Industry insights and more