North America Compounding Pharmacies Market Size & Outlook
Related Markets
North America compounding pharmacies market highlights
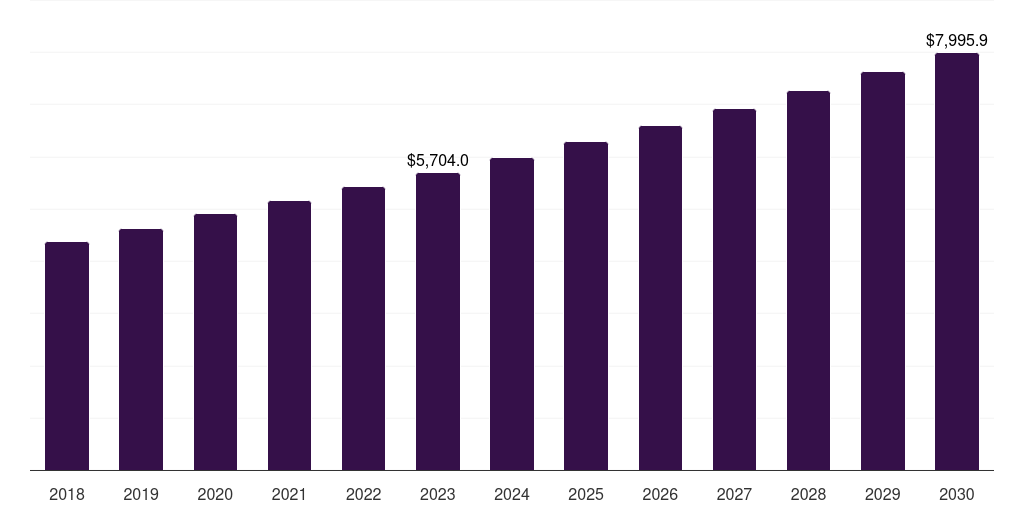
- The North America compounding pharmacies market generated a revenue of USD 5,704.0 million in 2023.
- The market is expected to grow at a CAGR of 4.9% from 2024 to 2030.
- In terms of segment, pain management was the largest revenue generating therapeutic area in 2023.
- Nutritional Supplements is the most lucrative therapeutic area segment registering the fastest growth during the forecast period.
- Country-wise, Canada is expected to register the highest CAGR from 2024 to 2030.
North America data book summary
| Market revenue in 2023 | USD 5,704.0 million |
| Market revenue in 2030 | USD 7,995.9 million |
| Growth rate | 4.9% (CAGR from 2023 to 2030) |
| Largest segment | Pain management |
| Fastest growing segment | Nutritional Supplements |
| Historical data covered | 2018 - 2022 |
| Base year for estimation | 2023 |
| Forecast period covered | 2024 - 2030 |
| Quantitative units | Revenue in USD million |
| Market segmentation | Hormone Replacement Therapy, Pain Management, Dermatology, Specialty Drugs, Nutritional Supplements, Other Therapeutic Areas |
| Key market players worldwide | Walgreens Boots Alliance Inc, Fresh Tracks Therapeutics Inc, Fagron SA, Albertsons Companies Inc Class A, Aurora Cannabis Inc, Trxade Health Inc, Specialist Pharmacy, Galenic, Apollo Hospitals Enterprise, Formul8, Fusion Apothecary |
Other key industry trends
- In terms of revenue, North America region accounted for 43.5% of the global compounding pharmacies market in 2023.
- Globally, North America is projected to lead the regional market in terms of revenue in 2030.
- Asia Pacific is the fastest growing regional market and is projected to reach USD 3,616.3 million by 2030.
No credit card required*
Horizon in a snapshot
- 30K+ Global Market Reports
- 120K+ Country Reports
- 1.2M+ Market Statistics
- 200K+ Company Profiles
- Industry insights and more
Compounding Pharmacies Market Scope
Compounding Pharmacies Market Companies
| Name | Profile | # Employees | HQ | Website |
|---|---|---|---|---|
| Fusion Apothecary | View profile | 11-50 | New York, New York, United States, North America | https://www.fusionrxny.com |
| Formul8 | View profile | 11-50 | Singapore, Central Region, Singapore, Asia | https://formul8.com/ |
| Apollo Hospitals Enterprise | View profile | 10001+ | Chennai, Tamil Nadu, India, Asia | https://www.apollohospitals.com |
| Galenic | View profile | - | Boulogne-billancourt, Ile-de-France, France, Europe | https://galenic.com |
| Specialist Pharmacy | View profile | 11-50 | Dagenham, Barking and Dagenham, United Kingdom, Europe | https://specialist-pharmacy.com/ |
| Trxade Health Inc | View profile | 8 | 2420 Brunello Trace, Lutz, FL, United States, 33558 | https://www.trxadehealth.com |
| Aurora Cannabis Inc | View profile | 1130 | 3498 63 Avenue, Leduc, AB, Canada, T9E 0G8 | https://www.auroramj.com |
| Albertsons Companies Inc Class A | View profile | 285000 | 250 Parkcenter Boulevard, Boise, ID, United States, 83706 | https://www.albertsonscompanies.com |
| Fagron SA | View profile | 3567 | Fascinatio Boulevard 350, Rotterdam, ZH, Netherlands, 3065 WB | https://www.fagron.com |
| Fresh Tracks Therapeutics Inc | View profile | 4 | 2000 Central Avenue, Suite 100, Boulder, CO, United States, 80301 | https://www.frtx.com |
| Walgreens Boots Alliance Inc | View profile | 331000 | 108 Wilmot Road, Deerfield, IL, United States, 60015 | https://www.walgreensbootsalliance.com |
North America compounding pharmacies market outlook
The databook is designed to serve as a comprehensive guide to navigating this sector. The databook focuses on market statistics denoted in the form of revenue and y-o-y growth and CAGR across the globe and regions. A detailed competitive and opportunity analyses related to compounding pharmacies market will help companies and investors design strategic landscapes.
Pain management was the largest segment with a revenue share of 32.97% in 2023. Horizon Databook has segmented the North America compounding pharmacies market based on hormone replacement therapy, pain management, dermatology, specialty drugs, nutritional supplements, other therapeutic areas covering the revenue growth of each sub-segment from 2018 to 2030.
- North America Compounding Pharmacies Therapeutic Area Outlook (Revenue, USD Million, 2018-2030)
- Other Therapeutic Areas
- Pain Management
- Dermatology
- Specialty Drugs
- Nutritional Supplements
- Hormone Replacement Therapy
- North America Compounding Pharmacies Age Cohort Outlook (Revenue, USD Million, 2018-2030)
- Geriatric
- Pediatric
- Adult
- North America Compounding Pharmacies Compounding Type Outlook (Revenue, USD Million, 2018-2030)
- Currently Unavailable Pharmaceutical Manufacturing (CUPM)
- Other Compounding Types
- Pharmaceutical Ingredient Alteration (PIA)
- Pharmaceutical Dosage Alteration (PDA)
- North America Compounding Pharmacies Sterility Outlook (Revenue, USD Million, 2018-2030)
- Non Sterile
- Sterile
Reasons to subscribe to North America compounding pharmacies market databook:
-
Access to comprehensive data: Horizon Databook provides over 1 million market statistics and 20,000+ reports, offering extensive coverage across various industries and regions.
-
Informed decision making: Subscribers gain insights into market trends, customer preferences, and competitor strategies, empowering informed business decisions.
-
Cost-Effective solution: It's recognized as the world's most cost-effective market research database, offering high ROI through its vast repository of data and reports.
-
Customizable reports: Tailored reports and analytics allow companies to drill down into specific markets, demographics, or product segments, adapting to unique business needs.
-
Strategic advantage: By staying updated with the latest market intelligence, companies can stay ahead of competitors, anticipate industry shifts, and capitalize on emerging opportunities.
Target buyers of North America compounding pharmacies market databook
-
Our clientele includes a mix of compounding pharmacies market companies, investment firms, advisory firms & academic institutions.
-
30% of our revenue is generated working with investment firms and helping them identify viable opportunity areas.
-
Approximately 65% of our revenue is generated working with competitive intelligence & market intelligence teams of market participants (manufacturers, service providers, etc.).
-
The rest of the revenue is generated working with academic and research not-for-profit institutes. We do our bit of pro-bono by working with these institutions at subsidized rates.
Horizon Databook provides a detailed overview of continent-level data and insights on the North America compounding pharmacies market , including forecasts for subscribers. This continent databook contains high-level insights into North America compounding pharmacies market from 2018 to 2030, including revenue numbers, major trends, and company profiles.
Partial client list
North America compounding pharmacies market size, by country, 2018-2030 (US$M)

North America Compounding Pharmacies Market Outlook Share, 2023 & 2030 (US$M)


Related statistics
No records
No related statistics found.
Sign up - it's easy, and free!
Sign up and get instant basic access to databook, upgrade
when ready, or enjoy our
free plan indefinitely.
Included in Horizon account
- 30K+ Global Market Reports
- 120K+ Country Reports
- 1.2M+ Market Statistics
- 200K+ Company Profiles
- Industry insights and more