Middle East & Africa Commercial Display Market Size & Outlook
Related Markets
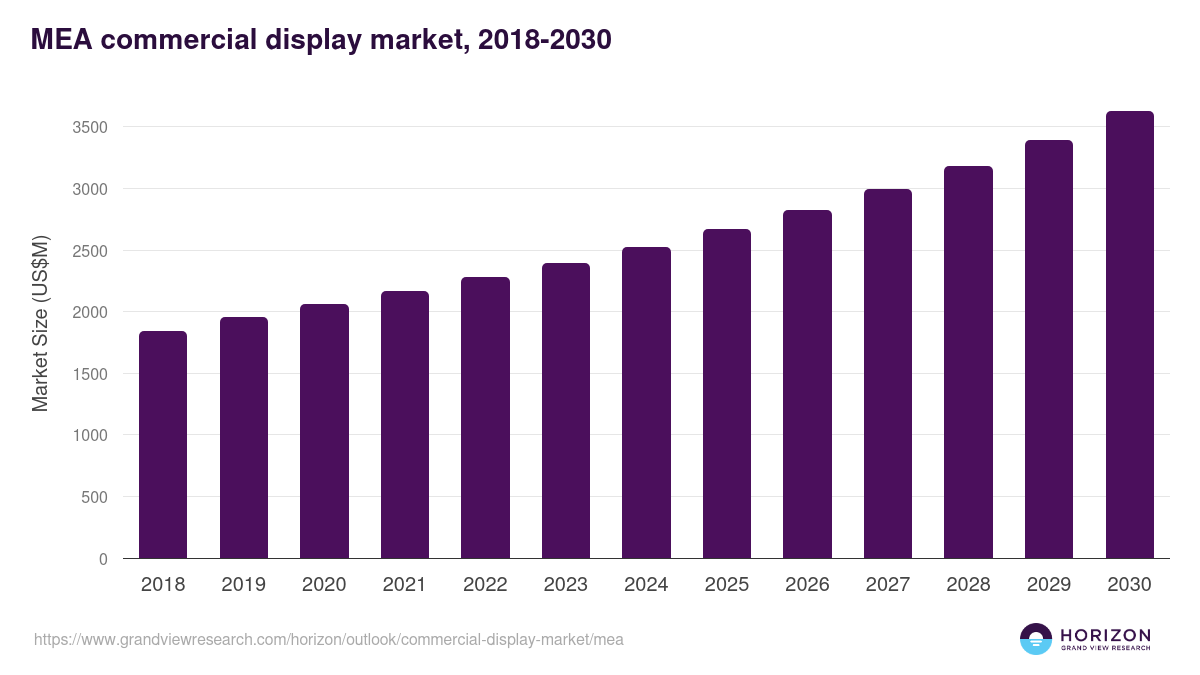
MEA commercial display market highlights
- The MEA commercial display market generated a revenue of USD 2,398.4 million in 2023.
- The market is expected to grow at a CAGR of 6.1% from 2024 to 2030.
- In terms of segment, digital signage was the largest revenue generating product in 2023.
- Digital Signage is the most lucrative product segment registering the fastest growth during the forecast period.
- Country-wise, UAE is expected to register the highest CAGR from 2024 to 2030.
MEA data book summary
| Market revenue in 2023 | USD 2,398.4 million |
| Market revenue in 2030 | USD 3,626.6 million |
| Growth rate | 6.1% (CAGR from 2023 to 2030) |
| Largest segment | Digital signage |
| Fastest growing segment | Digital Signage |
| Historical data covered | 2018 - 2022 |
| Base year for estimation | 2023 |
| Forecast period covered | 2024 - 2030 |
| Quantitative units | Revenue in USD million |
| Market segmentation | Digital Signage, Display Monitor, Display TVs |
| Key market players worldwide | Samsung Electronics Co Ltd, CDW Corp, Cisco Systems Inc, Dell Technologies Inc Ordinary Shares - Class C, Koninklijke Philips NV, LG Display Co Ltd ADR, NEC Corp, Panasonic Holdings Corp, Daktronics Inc, Sharp Corp, Sony Group Corp |
Other key industry trends
- In terms of revenue, MEA region accounted for 4.7% of the global commercial display market in 2023.
- Globally, Europe is projected to lead the regional market in terms of revenue in 2030.
- Asia Pacific is the fastest growing regional market and is projected to reach USD 21,278.0 million by 2030.
No credit card required*
Horizon in a snapshot
- 30K+ Global Market Reports
- 120K+ Country Reports
- 1.2M+ Market Statistics
- 200K+ Company Profiles
- Industry insights and more
Commercial Display Market Scope
Commercial Display Market Companies
| Name | Profile | # Employees | HQ | Website |
|---|---|---|---|---|
| CDW Corp | View profile | 15100 | 200 North Milwaukee Avenue, Vernon Hills, IL, United States, 60061 | https://www.cdw.com |
| Daktronics Inc | View profile | - | - | - |
| LG Display Co Ltd ADR | View profile | 66418 | LG Twin Towers, 128 Yeoui-daero, Yeongdeungpo-gu, Seoul, Korea, Republic of, 07336 | https://www.lgdisplay.com |
| Sharp Corp | View profile | 46200 | 1 Takumi-machi, Sakai-ku, Sakai-shi, Osaka, Japan, 590-8522 | https://www.sharp.co.jp |
| Cisco Systems Inc | View profile | 84900 | 170 West Tasman Drive, San Jose, CA, United States, 95134-1706 | https://www.cisco.com |
| NEC Corp | View profile | 118527 | 7-1, Shiba 5-chome, Minato-ku, Tokyo, Japan, 108-8001 | https://www.nec.com |
| Samsung Electronics Co Ltd | View profile | 124804 | 129, Samsung-ro, Yeongtong-gu, Gyeonggi-do, Suwon-si, Korea, Republic of, 443-742 | https://www.samsung.com |
| Panasonic Holdings Corp | View profile | 230025 | 1006, Oaza Kadoma, Kadoma-shi, Osaka, Japan, 571-8501 | https://holdings.panasonic |
| Sony Group Corp | View profile | 113000 | 7-1, Konan 1-Chome, Minato-ku, Tokyo, Japan, 108-0075 | https://www.sony.com |
| Dell Technologies Inc Ordinary Shares - Class C | View profile | 120000 | One Dell Way, Round Rock, TX, United States, 78682 | https://www.delltechnologies.com |
| Koninklijke Philips NV | View profile | 73712 | Philips Center, Amstelplein 2, Amsterdam, Netherlands, 1096 BC | https://www.philips.com |
Middle East & Africa commercial display market outlook
The databook is designed to serve as a comprehensive guide to navigating this sector. The databook focuses on market statistics denoted in the form of revenue and y-o-y growth and CAGR across the globe and regions. A detailed competitive and opportunity analyses related to commercial display market will help companies and investors design strategic landscapes.
Digital signage was the largest segment with a revenue share of 37.12% in 2024. Horizon Databook has segmented the Middle East & Africa commercial display market based on digital signage, display monitor, display tvs covering the revenue growth of each sub-segment from 2018 to 2030.
Reasons to subscribe to Middle East & Africa commercial display market databook:
-
Access to comprehensive data: Horizon Databook provides over 1 million market statistics and 20,000+ reports, offering extensive coverage across various industries and regions.
-
Informed decision making: Subscribers gain insights into market trends, customer preferences, and competitor strategies, empowering informed business decisions.
-
Cost-Effective solution: It's recognized as the world's most cost-effective market research database, offering high ROI through its vast repository of data and reports.
-
Customizable reports: Tailored reports and analytics allow companies to drill down into specific markets, demographics, or product segments, adapting to unique business needs.
-
Strategic advantage: By staying updated with the latest market intelligence, companies can stay ahead of competitors, anticipate industry shifts, and capitalize on emerging opportunities.
Target buyers of Middle East & Africa commercial display market databook
-
Our clientele includes a mix of commercial display market companies, investment firms, advisory firms & academic institutions.
-
30% of our revenue is generated working with investment firms and helping them identify viable opportunity areas.
-
Approximately 65% of our revenue is generated working with competitive intelligence & market intelligence teams of market participants (manufacturers, service providers, etc.).
-
The rest of the revenue is generated working with academic and research not-for-profit institutes. We do our bit of pro-bono by working with these institutions at subsidized rates.
Horizon Databook provides a detailed overview of continent-level data and insights on the Middle East & Africa commercial display market , including forecasts for subscribers. This continent databook contains high-level insights into Middle East & Africa commercial display market from 2018 to 2030, including revenue numbers, major trends, and company profiles.
Partial client list
MEA commercial display market size, by country, 2018-2030 (US$M)

Middle East & Africa Commercial Display Market Outlook Share, 2024 & 2030 (US$M)


Related statistics
Sign up - it's easy, and free!
Sign up and get instant basic access to databook, upgrade
when ready, or enjoy our
free plan indefinitely.
Included in Horizon account
- 30K+ Global Market Reports
- 120K+ Country Reports
- 1.2M+ Market Statistics
- 200K+ Company Profiles
- Industry insights and more