Asia Pacific Chemical Distribution Market Size & Outlook
Related Markets
Asia Pacific chemical distribution market highlights
- The Asia Pacific chemical distribution market generated a revenue of USD 167,378.5 million in 2024.
- The market is expected to grow at a CAGR of 7.6% from 2025 to 2030.
- In terms of segment, commodity chemicals was the largest revenue generating type in 2024.
- Specialty Chemicals is the most lucrative type segment registering the fastest growth during the forecast period.
- Country-wise, Japan is expected to register the highest CAGR from 2025 to 2030.
Asia Pacific data book summary
| Market revenue in 2024 | USD 167,378.5 million |
| Market revenue in 2030 | USD 255,639.8 million |
| Growth rate | 7.6% (CAGR from 2025 to 2030) |
| Largest segment | Commodity chemicals |
| Fastest growing segment | Specialty Chemicals |
| Historical data covered | 2018 - 2023 |
| Base year for estimation | 2024 |
| Forecast period covered | 2025 - 2030 |
| Quantitative units | Revenue in USD million |
| Market segmentation | Specialty Chemicals, Commodity Chemicals |
| Key market players worldwide | Apollo Global Management Inc Class A, Helm AG, Brenntag Biosector, Teradyne Inc, Azelis Group NV, Ashland Inc, IMCD NV, Biesterfeld, Reda |
Other key industry trends
- In terms of revenue, Asia Pacific region accounted for 62.2% of the global chemical distribution market in 2024.
- Globally, Asia Pacific is projected to lead the regional market in terms of revenue in 2030.
- Asia Pacific is the fastest growing regional market and is projected to reach USD 255,639.8 million by 2030.
No credit card required*
Horizon in a snapshot
- 30K+ Global Market Reports
- 120K+ Country Reports
- 1.2M+ Market Statistics
- 200K+ Company Profiles
- Industry insights and more
Chemical Distribution Market Scope
Chemical Distribution Market Companies
| Name | Profile | # Employees | HQ | Website |
|---|---|---|---|---|
| Reda | View profile | 501-1000 | Valle Mosso, Piemonte, Italy, Europe | http://www.reda1865.com/ |
| Brenntag Biosector | View profile | - | Ballerup, Hovedstaden, Denmark, Europe | - |
| Helm AG | View profile | 1001-5000 | Hamburg, Hamburg, Germany, Europe | https://www.helmag.com |
| IMCD NV | View profile | 4948 | Wilhelminaplein 32, Rotterdam, Netherlands, 3072 DE | https://www.imcdgroup.com |
| Azelis Group NV | View profile | 4206 | Posthofbrug 12, Box 6, Antwerp, Belgium, B-2600 | https://www.azelis.com |
| Apollo Global Management Inc Class A | View profile | 4945 | 9 West 57th Street, 42nd Floor, New York, NY, United States, 10019 | https://www.apollo.com |
| Biesterfeld | View profile | 501-1000 | Hamburg, Hamburg, Germany, Europe | https://www.biesterfeld.com/ |
| Ashland Inc | View profile | 3800 | 8145 Blazer Drive, Wilmington, DE, United States, 19808 | http://www.ashland.com |
| Teradyne Inc | View profile | 6500 | 600 Riverpark Drive, North Reading, MA, United States, 01864 | https://www.teradyne.com |
Asia Pacific chemical distribution market outlook
The databook is designed to serve as a comprehensive guide to navigating this sector. The databook focuses on market statistics denoted in the form of revenue and y-o-y growth and CAGR across the globe and regions. A detailed competitive and opportunity analyses related to chemical distribution market will help companies and investors design strategic landscapes.
Commodity chemicals was the largest segment with a revenue share of 70.12% in 2024. Horizon Databook has segmented the Asia Pacific chemical distribution market based on specialty chemicals, commodity chemicals covering the revenue growth of each sub-segment from 2018 to 2030.
Previously the U.S. and Western Europe were the major exporters in the market; however, the Asia Pacific region has surpassed them due to an increase in the chemical production capacity in China and India.
This can be attributed to investments in advanced technologies and the construction of new plants for chemical manufacturing. The region is characterized by easy availability of cheap labor, land, and resources.
For instance, in the automobile industry, chemicals offer properties, such as enhanced flexibility to interior and exterior components of a vehicle, corrosion resistance, and to make material lightweight. In the food & beverage industry, they are used as food preservatives, flavoring agents, and stabilizing agents.
Reasons to subscribe to Asia Pacific chemical distribution market databook:
-
Access to comprehensive data: Horizon Databook provides over 1 million market statistics and 20,000+ reports, offering extensive coverage across various industries and regions.
-
Informed decision making: Subscribers gain insights into market trends, customer preferences, and competitor strategies, empowering informed business decisions.
-
Cost-Effective solution: It's recognized as the world's most cost-effective market research database, offering high ROI through its vast repository of data and reports.
-
Customizable reports: Tailored reports and analytics allow companies to drill down into specific markets, demographics, or product segments, adapting to unique business needs.
-
Strategic advantage: By staying updated with the latest market intelligence, companies can stay ahead of competitors, anticipate industry shifts, and capitalize on emerging opportunities.
Target buyers of Asia Pacific chemical distribution market databook
-
Our clientele includes a mix of chemical distribution market companies, investment firms, advisory firms & academic institutions.
-
30% of our revenue is generated working with investment firms and helping them identify viable opportunity areas.
-
Approximately 65% of our revenue is generated working with competitive intelligence & market intelligence teams of market participants (manufacturers, service providers, etc.).
-
The rest of the revenue is generated working with academic and research not-for-profit institutes. We do our bit of pro-bono by working with these institutions at subsidized rates.
Horizon Databook provides a detailed overview of continent-level data and insights on the Asia Pacific chemical distribution market , including forecasts for subscribers. This continent databook contains high-level insights into Asia Pacific chemical distribution market from 2018 to 2030, including revenue numbers, major trends, and company profiles.
Partial client list
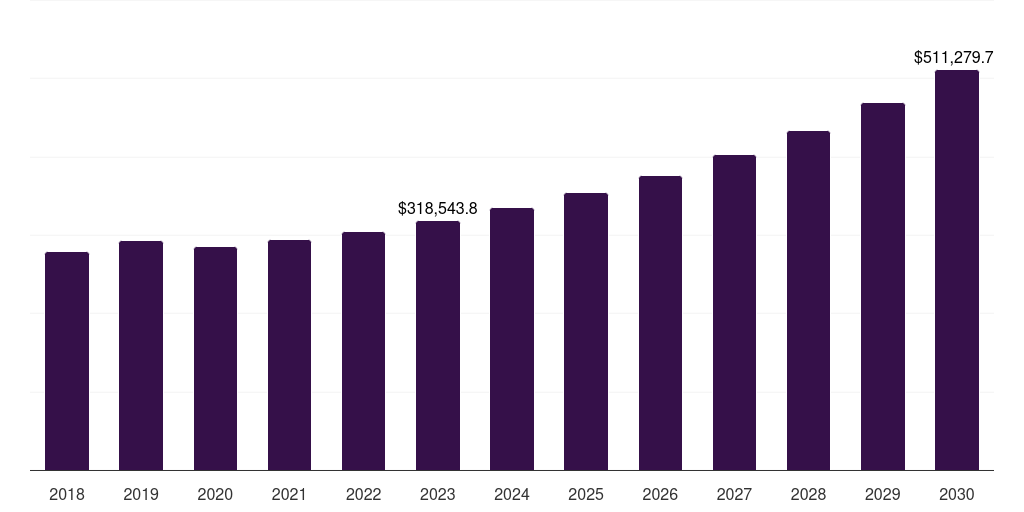
Asia Pacific chemical distribution market size, by country, 2018-2030 (US$M)

Asia Pacific Chemical Distribution Market Outlook Share, 2024 & 2030 (US$M)


Related statistics
Sign up - it's easy, and free!
Sign up and get instant basic access to databook, upgrade
when ready, or enjoy our
free plan indefinitely.
Included in Horizon account
- 30K+ Global Market Reports
- 120K+ Country Reports
- 1.2M+ Market Statistics
- 200K+ Company Profiles
- Industry insights and more