U.S. Caps And Closures Market Size & Outlook, 2026-2033
Related Markets
U.S. caps and closures market highlights
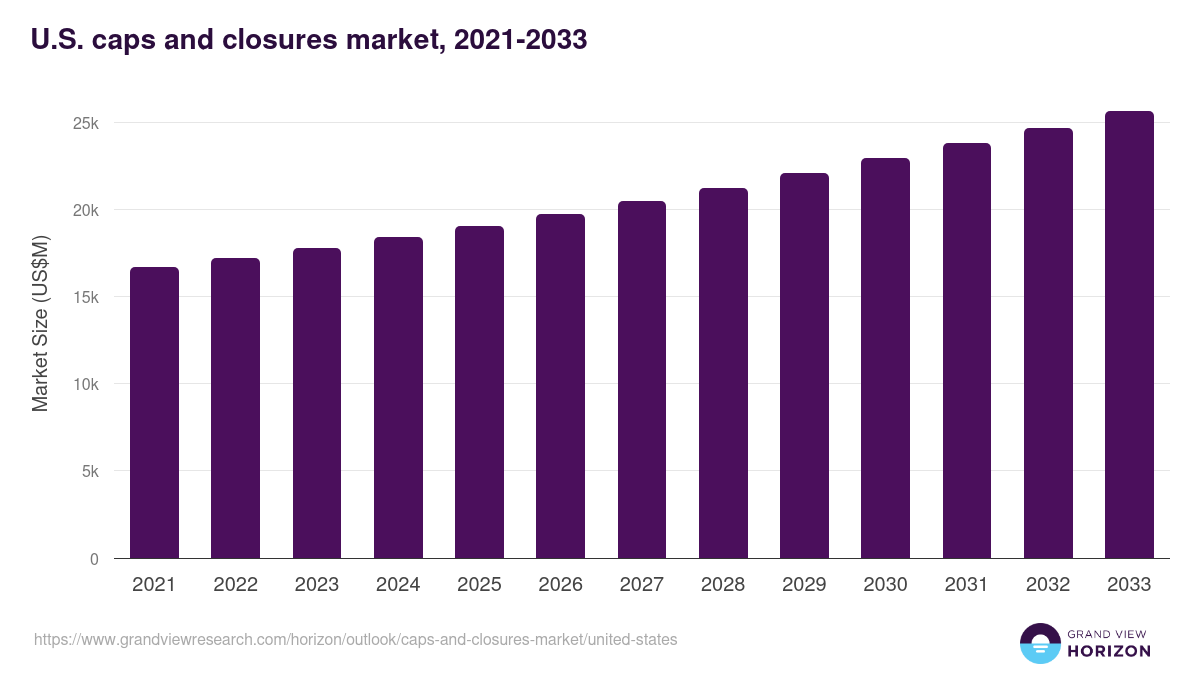
- The U.S. caps and closures market generated a revenue of USD 19,054.1 million in 2025 and is expected to reach USD 25,631.7 million by 2033.
- The U.S. market is expected to grow at a CAGR of 3.8% from 2026 to 2033.
- In terms of segment, dispensing caps was the largest revenue generating product in 2025.
- Dispensing Caps is the most lucrative product segment registering the fastest growth during the forecast period.
Caps and closures market data book summary
| Market revenue in 2025 | USD 19,054.1 million |
| Market revenue in 2033 | USD 25,631.7 million |
| Growth rate | 3.8% (CAGR from 2026 to 2033) |
| Largest segment | Dispensing caps |
| Fastest growing segment | Dispensing Caps |
| Historical data | 2021 - 2024 |
| Base year | 2025 |
| Forecast period | 2026 - 2033 |
| Quantitative units | Revenue in USD million |
| Market segmentation | Crown Closures, Aerosol Closures, Dispensing Caps, Screw Closures, Others Product |
| Key market players worldwide | Crown Castle Inc, Amcor PLC, Ball Corp, Silgan Holdings Inc, AptarGroup Inc, Sonoco Products Co, Nippon Chemical Industrial, Closure Systems International, BERICAP, Webpac, Jelinek Cork Group, Novvia Group, Pelliconi, Berkshire Hathaway Inc Class B, UNITED CAPS |
Other key industry trends
- In terms of revenue, U.S. accounted for 17.2% of the global caps and closures market in 2025.
- Country-wise, U.S. is expected to lead the global market in terms of revenue in 2033.
- In North America, U.S. caps and closures market is projected to lead the regional market in terms of revenue in 2033.
- Mexico is the fastest growing regional market in North America and is projected to reach USD 1,812.7 million by 2033.
No credit card required*
Horizon in a snapshot
- 30K+ Global Market Reports
- 120K+ Country Reports
- 1.2M+ Market Statistics
- 200K+ Company Profiles
- Industry insights and more
Caps And Closures Market Scope
Caps And Closures Market Companies
| Name | Profile | # Employees | HQ | Website |
|---|---|---|---|---|
| UNITED CAPS | View profile | 251-500 | Wiltz, Diekirch, Luxembourg, Europe | https://www.unitedcaps.com |
| Berkshire Hathaway Inc Class B | View profile | 396500 | 3555 Farnam Street, Omaha, NE, United States, 68131 | https://www.berkshirehathaway.com |
| Pelliconi | View profile | 501-1000 | Bologna, Emilia-Romagna, Italy, Europe | http://www.pelliconi.com |
| Novvia Group | View profile | 1-10 | St Louis, Missouri, United States, North America | https://novviagroup.com/ |
| Jelinek Cork Group | View profile | 101-250 | Oakville, Ontario, Canada, North America | https://www.jelinek.com |
| Webpac | View profile | 101-250 | London, England, United Kingdom, Europe | https://www.webpackaging.com/ |
| BERICAP | View profile | 501-1000 | Budenheim, Rheinland-Pfalz, Germany, Europe | https://www.bericap.com |
| Nippon Chemical Industrial | View profile | 501-1000 | Koto, Tokyo, Japan, Asia | https://www.nippon-chem.co.jp/ |
| Closure Systems International | View profile | 1001-5000 | Indianapolis, Indiana, United States, North America | http://csiclosures.com |
| Silgan Holdings Inc | View profile | 14400 | 4 Landmark Square, Suite 400, Stamford, CT, United States, 06901 | https://www.silganholdings.com |
| Ball Corp | View profile | 21000 | 9200 West 108th Circle, Westminster, CO, United States, 80021 | https://www.ball.com |
| Amcor PLC | View profile | 41000 | 83 Tower Road North, Warmley, Bristol, United Kingdom, BS30 8XP | https://www.amcor.com |
| Crown Castle Inc | View profile | 5000 | 8020 Katy Freeway, Houston, TX, United States, 77024-1908 | https://www.crowncastle.com |
| AptarGroup Inc | View profile | 13800 | 265 Exchange Drive, Suite 301, Crystal Lake, IL, United States, 60014 | https://www.aptar.com |
| Sonoco Products Co | View profile | 23000 | 1 N. Second Street, Hartsville, SC, United States, 29550 | http://www.sonoco.com |
U.S. caps and closures market outlook
The databook is designed to serve as a comprehensive guide to navigating this sector. The databook focuses on market statistics denoted in the form of revenue and y-o-y growth and CAGR across the globe and regions. A detailed competitive and opportunity analyses related to caps and closures market will help companies and investors design strategic landscapes.
Dispensing caps was the largest segment with a revenue share of 38.93% in 2025. Horizon Databook has segmented the U.S. caps and closures market based on crown closures, aerosol closures, dispensing caps, screw closures, others product covering the revenue growth of each sub-segment from 2021 to 2033.
The presence of a large, urbanized population in the U.S. is likely to increase the spending on consumer products. High disposable income of the population is expected to increase the spending on goods with premium or luxury packaging.
The humongous demand base for out-of-home food due to busy work-life schedules and convenience is expected to bolster the demand for packaged food items in the U.S., which is likely to result in high production and supply of food packaging products.
Reasons to subscribe to U.S. caps and closures market databook:
-
Access to comprehensive data: Horizon Databook provides over 1 million market statistics and 20,000+ reports, offering extensive coverage across various industries and regions.
-
Informed decision making: Subscribers gain insights into market trends, customer preferences, and competitor strategies, empowering informed business decisions.
-
Cost-Effective solution: It's recognized as the world's most cost-effective market research database, offering high ROI through its vast repository of data and reports.
-
Customizable reports: Tailored reports and analytics allow companies to drill down into specific markets, demographics, or product segments, adapting to unique business needs.
-
Strategic advantage: By staying updated with the latest market intelligence, companies can stay ahead of competitors, anticipate industry shifts, and capitalize on emerging opportunities.
Target buyers of U.S. caps and closures market databook
-
Our clientele includes a mix of caps and closures market companies, investment firms, advisory firms & academic institutions.
-
30% of our revenue is generated working with investment firms and helping them identify viable opportunity areas.
-
Approximately 65% of our revenue is generated working with competitive intelligence & market intelligence teams of market participants (manufacturers, service providers, etc.).
-
The rest of the revenue is generated working with academic and research not-for-profit institutes. We do our bit of pro-bono by working with these institutions at subsidized rates.
Horizon Databook provides a detailed overview of country-level data and insights on the U.S. caps and closures market , including forecasts for subscribers. This country databook contains high-level insights into U.S. caps and closures market from 2021 to 2033, including revenue numbers, major trends, and company profiles.
Partial client list
U.S. caps and closures market size, by product, 2021-2033 (US$M)

U.S. Caps And Closures Market Outlook Share, 2025 & 2033 (US$M)


Related statistics
Sign up - it's easy, and free!
Sign up and get instant basic access to databook, upgrade
when ready, or enjoy our
free plan indefinitely.
Included in Horizon account
- 30K+ Global Market Reports
- 120K+ Country Reports
- 1.2M+ Market Statistics
- 200K+ Company Profiles
- Industry insights and more