U.S. Biotechnology Market Size & Outlook, 2024-2030
Related Markets
U.S. biotechnology market highlights
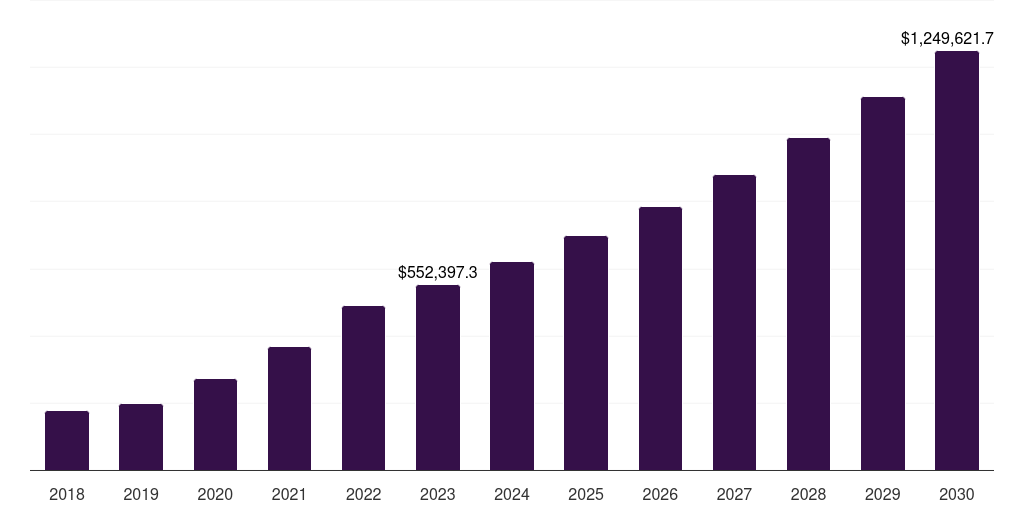
- The U.S. biotechnology market generated a revenue of USD 552,397.3 million in 2023 and is expected to reach USD 1,249,621.7 million by 2030.
- The U.S. market is expected to grow at a CAGR of 12.4% from 2024 to 2030.
- In terms of segment, health was the largest revenue generating application in 2023.
- Bioinformatics is the most lucrative application segment registering the fastest growth during the forecast period.
Biotechnology market data book summary
| Market revenue in 2023 | USD 552,397.3 million |
| Market revenue in 2030 | USD 1,249,621.7 million |
| Growth rate | 12.4% (CAGR from 2023 to 2030) |
| Largest segment | Health |
| Fastest growing segment | Bioinformatics |
| Historical data | 2018 - 2022 |
| Base year | 2023 |
| Forecast period | 2024 - 2030 |
| Quantitative units | Revenue in USD million |
| Market segmentation | Health, Food & Agriculture, Natural reseources & Environment, Industrial Processing, Bioinformatics, Others Applications |
| Key market players worldwide | AstraZeneca PLC, Gilead Sciences Inc, Bristol-Myers Squibb Co, Sanofi SA, Biogen Inc, Abbott Laboratories, Pfizer Inc, Amgen Inc, Novo Nordisk A/S ADR, Merck KGaA, Johnson & Johnson, Novartis AG ADR, Roche Holding AG, Lonza Group Ltd |
Other key industry trends
- In terms of revenue, U.S. accounted for 35.6% of the global biotechnology market in 2023.
- Country-wise, U.S. is expected to lead the global market in terms of revenue in 2030.
- In North America, U.S. biotechnology market is projected to lead the regional market in terms of revenue in 2030.
- Canada is the fastest growing regional market in North America and is projected to reach USD 206,813.8 million by 2030.
No credit card required*
Horizon in a snapshot
- 30K+ Global Market Reports
- 120K+ Country Reports
- 1.2M+ Market Statistics
- 200K+ Company Profiles
- Industry insights and more
Biotechnology Market Scope
Biotechnology Market Companies
| Name | Profile | # Employees | HQ | Website |
|---|---|---|---|---|
| Biogen Inc | View profile | 7570 | 225 Binney Street, Cambridge, MA, United States, 02142 | https://www.biogen.com |
| Gilead Sciences Inc | View profile | 18000 | 333 Lakeside Drive, Foster, CA, United States, 94404 | https://www.gilead.com |
| AstraZeneca PLC | View profile | 89900 | 1 Francis Crick Avenue, Cambridge Biomedical Campus, Cambridge, United Kingdom, CB2 0AA | https://www.astrazeneca.com |
| Novo Nordisk A/S ADR | View profile | 66015 | Novo Alle 1, Bagsvaerd, Denmark, 2880 | https://www.novonordisk.com |
| Bristol-Myers Squibb Co | View profile | 34100 | Route 206 and Province Line Road, Princeton, New Jersey, NJ, United States, 08543 | https://www.bms.com |
| Roche Holding AG | View profile | 103605 | Grenzacherstrasse 124, Basel, Switzerland, 4070 | https://www.roche.com |
| Lonza Group Ltd | View profile | 18000 | Muenchensteinerstrasse 38, Basel, Switzerland, CH-4002 | https://www.lonza.com |
| Sanofi SA | View profile | 87994 | 46, avenue de la Grande Armée, Paris, France, 75017 | https://www.sanofi.com |
| Pfizer Inc | View profile | 88000 | 66 Hudson Boulevard East, New York, NY, United States, 10001-2192 | https://www.pfizer.com |
| Abbott Laboratories | View profile | 114000 | 100 Abbott Park Road, Abbott Park, IL, United States, 60064-6400 | https://www.abbottinvestor.com |
| Merck KGaA | View profile | 62345 | Frankfurter Strasse 250, Darmstadt, HE, Germany, 64293 | https://www.emdgroup.com |
| Amgen Inc | View profile | 26700 | One Amgen Center Drive, Thousand Oaks, CA, United States, 91320-1799 | https://www.amgen.com |
| Novartis AG ADR | View profile | 76057 | Lichtstrasse 35, Basel, Switzerland, 4056 | https://www.novartis.com |
| Johnson & Johnson | View profile | 134400 | One Johnson and Johnson Plaza, New Brunswick, NJ, United States, 08933 | https://www.jnj.com |
U.S. biotechnology market outlook
The databook is designed to serve as a comprehensive guide to navigating this sector. The databook focuses on market statistics denoted in the form of revenue and y-o-y growth and CAGR across the globe and regions. A detailed competitive and opportunity analyses related to biotechnology market will help companies and investors design strategic landscapes.
Health was the largest segment with a revenue share of 44.26% in 2023. Horizon Databook has segmented the U.S. biotechnology market based on health, food & agriculture, natural reseources & environment, industrial processing, bioinformatics, others applications covering the revenue growth of each sub-segment from 2018 to 2030.
A majority of the clinical development in life sciences technologies for applications in oncology and infectious diseases is reported in the U.S. The successful completion of the human genome project paved way for the development of personalized medicine approaches.
Research, development, and commercialization of personalized medicine services and products takes place faster in the U.S. as compared to other countries around the globe. Moreover, introduction of automated solutions is anticipated to increase the adoption of life sciences tools among the end users.
For instance, the Smart Extraction technology developed by Analytik Jena is used to extract high molecular weight DNA from a range of samples. This automated extraction and purification of nucleic acids simplifies the workflow, increases efficiency, yield, and DNA quality.
Reasons to subscribe to U.S. biotechnology market databook:
-
Access to comprehensive data: Horizon Databook provides over 1 million market statistics and 20,000+ reports, offering extensive coverage across various industries and regions.
-
Informed decision making: Subscribers gain insights into market trends, customer preferences, and competitor strategies, empowering informed business decisions.
-
Cost-Effective solution: It's recognized as the world's most cost-effective market research database, offering high ROI through its vast repository of data and reports.
-
Customizable reports: Tailored reports and analytics allow companies to drill down into specific markets, demographics, or product segments, adapting to unique business needs.
-
Strategic advantage: By staying updated with the latest market intelligence, companies can stay ahead of competitors, anticipate industry shifts, and capitalize on emerging opportunities.
Target buyers of U.S. biotechnology market databook
-
Our clientele includes a mix of biotechnology market companies, investment firms, advisory firms & academic institutions.
-
30% of our revenue is generated working with investment firms and helping them identify viable opportunity areas.
-
Approximately 65% of our revenue is generated working with competitive intelligence & market intelligence teams of market participants (manufacturers, service providers, etc.).
-
The rest of the revenue is generated working with academic and research not-for-profit institutes. We do our bit of pro-bono by working with these institutions at subsidized rates.
Horizon Databook provides a detailed overview of country-level data and insights on the U.S. biotechnology market , including forecasts for subscribers. This country databook contains high-level insights into U.S. biotechnology market from 2018 to 2030, including revenue numbers, major trends, and company profiles.
Partial client list
U.S. biotechnology market size, by application, 2018-2030 (US$M)

U.S. Biotechnology Market Outlook Share, 2023 & 2030 (US$M)


Related statistics
Sign up - it's easy, and free!
Sign up and get instant basic access to databook, upgrade
when ready, or enjoy our
free plan indefinitely.
Included in Horizon account
- 30K+ Global Market Reports
- 120K+ Country Reports
- 1.2M+ Market Statistics
- 200K+ Company Profiles
- Industry insights and more