Middle East & Africa Bioactive Ingredients Market Size & Outlook
Related Markets
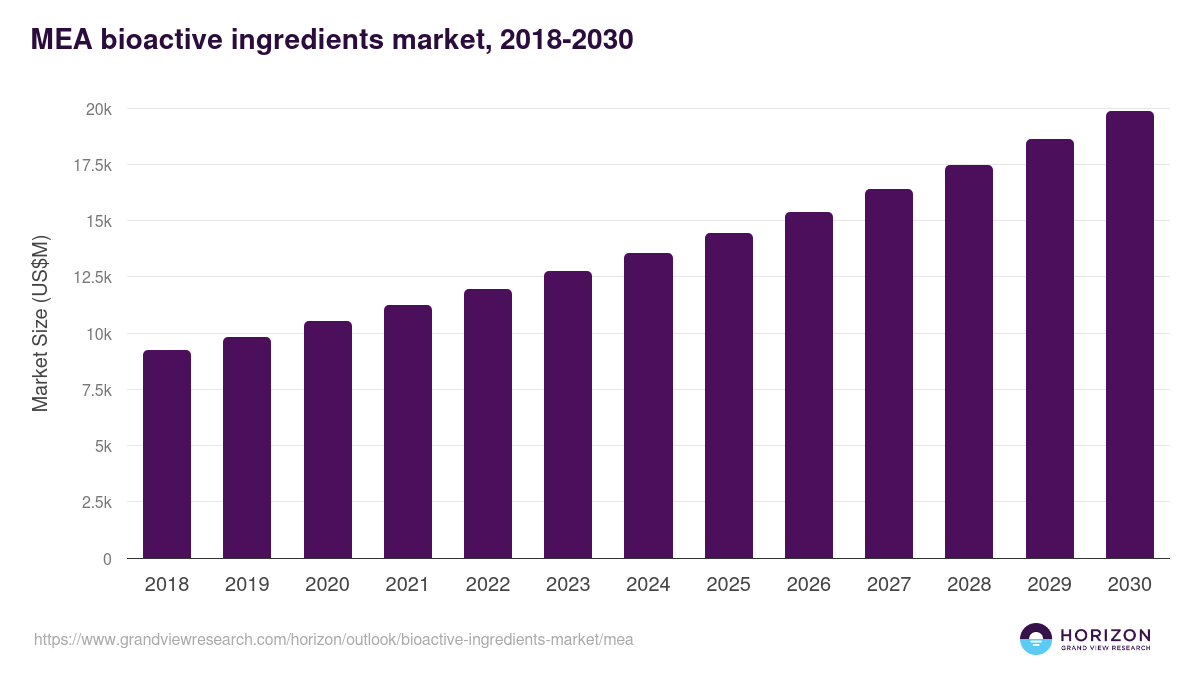
MEA bioactive ingredients market highlights
- The MEA bioactive ingredients market generated a revenue of USD 11,985.5 million in 2022.
- The market is expected to grow at a CAGR of 6.5% from 2023 to 2030.
- In terms of segment, fiber was the largest revenue generating product in 2022.
- Omega 3 PUFA is the most lucrative product segment registering the fastest growth during the forecast period.
- Country-wise, Saudi Arabia is expected to register the highest CAGR from 2023 to 2030.
MEA data book summary
| Market revenue in 2022 | USD 11,985.5 million |
| Market revenue in 2030 | USD 19,868.2 million |
| Growth rate | 6.5% (CAGR from 2023 to 2030) |
| Largest segment | Fiber |
| Fastest growing segment | Omega 3 PUFA |
| Historical data covered | 2018 - 2021 |
| Base year for estimation | 2022 |
| Forecast period covered | 2023 - 2030 |
| Quantitative units | Revenue in USD million |
| Market segmentation | Fiber, Vitamins, Omega 3 PUFA, Plant Extracts, Minerals, Carotenoids & Antioxidants, Probiotics, Other Ingredients |
| Key market players worldwide | Archer-Daniels Midland Co, Basf SE, Cargill, Ingredion Inc, Ajinomoto Co Inc, Owens & Minor Inc, Sensient Technologies Corp, DuPont de Nemours Inc |
Other key industry trends
- In terms of revenue, MEA region accounted for 6.9% of the global bioactive ingredients market in 2022.
- Globally, Asia Pacific is projected to lead the regional market in terms of revenue in 2030.
- Asia Pacific is the fastest growing regional market and is projected to reach USD 127,371.4 million by 2030.
Fiber was the largest segment with a revenue share of 23.78% in 2022. Horizon Databook has segmented the Middle East & Africa bioactive ingredients market based on fiber, vitamins, omega 3 pufa, plant extracts, minerals, carotenoids & antioxidants, probiotics, other ingredients covering the revenue growth of each sub-segment from 2018 to 2030.
Bioactive ingredients are used in several nutraceutical and food & beverages as supplements to promote good health and development of human body. They also help to prevent the body from several chronical diseases such as cardiovascular disease, diabetes, hypertension, cancer, and others.
Thus, the expanding food supplement and nutraceutical industry due to increasing prevalence of chronic diseases and increasing awareness among people about strengthening immunity and proper nutritional intake is contributing towards the growth of the nutraceutical industry which in turn is driving the demand for bioactive ingredients.
According to the International Diabetes Federation Diabetes Atlas, in 2021, MEA witnessed the highest prevalence of around 16.2% and the second highest expected increase of around 86% in the number of people suffering from diabetes, which is expected to be around 136 million by 2045.
Key Regions: U.S. , UK , Japan , Brazil , South Africa
No credit card required*
Horizon in a snapshot
- 30K+ Global Market Reports
- 120K+ Country Reports
- 1.2M+ Market Statistics
- 200K+ Company Profiles
- Industry insights and more
Bioactive Ingredients Market Scope
Bioactive Ingredients Market Companies
| Name | Profile | # Employees | HQ | Website |
|---|---|---|---|---|
| Ajinomoto Co Inc | View profile | 43318 | 15-1, Kyobashi 1-chome, Chuo-ku, Tokyo, Japan, 104-8315 | http://www.ajinomoto.co.jp |
| Owens & Minor Inc | View profile | 13700 | 9120 Lockwood Boulevard, Mechanicsville, VA, United States, 23116 | https://www.owens-minor.com |
| Cargill | View profile | 10001+ | Minneapolis, Minnesota, United States, North America | http://www.cargill.com |
| Ingredion Inc | View profile | 11600 | 5 Westbrook Corporate Center, Westchester, IL, United States, 60154 | https://www.ingredion.com |
| DuPont de Nemours Inc | View profile | 24000 | 974 Centre Road, Building 730, Wilmington, DE, United States, 19805 | https://www.dupont.com |
| Archer-Daniels Midland Co | View profile | 41802 | 77 West Wacker Drive, Suite 4600, Chicago, IL, United States, 60601 | https://www.adm.com |
| Sensient Technologies Corp | View profile | 3956 | 777 East Wisconsin Avenue, Milwaukee, WI, United States, 53202-5304 | https://www.sensient.com |
| Basf SE | View profile | 111855 | Carl-Bosch-Strasse 38, Ludwigshafen am Rhein, Germany, 67056 | https://www.basf.com |
MEA bioactive ingredients market size, by country, 2018-2030 (US$M)

Middle East & Africa Bioactive Ingredients Market Outlook Share, 2022 & 2030 (US$M)


Related statistics
Sign up - it's easy, and free!
Sign up and get instant basic access to databook, upgrade
when ready, or enjoy our
free plan indefinitely.
Included in Horizon account
- 30K+ Global Market Reports
- 120K+ Country Reports
- 1.2M+ Market Statistics
- 200K+ Company Profiles
- Industry insights and more