North America Automated Visual Field Analyzer Market Size & Outlook
Related Markets
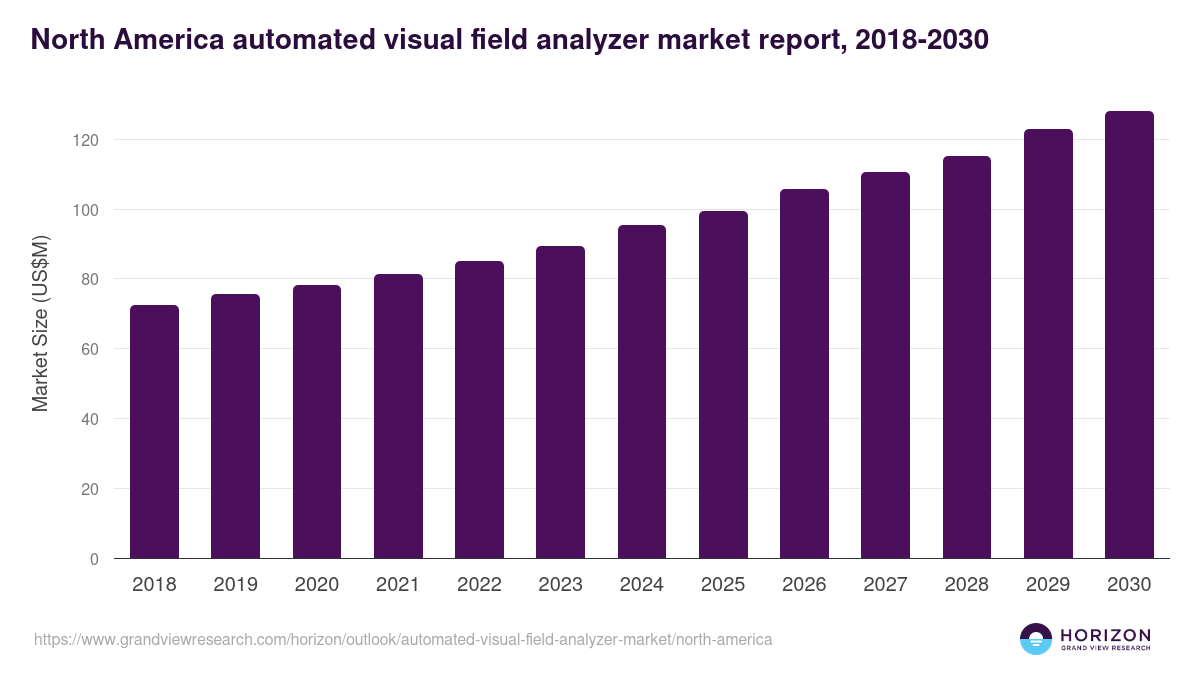
North America automated visual field analyzer market highlights
- The North America automated visual field analyzer market generated a revenue of USD 95.3 million in 2024.
- The market is expected to grow at a CAGR of 5.2% from 2025 to 2030.
- In terms of segment, static was the largest revenue generating type in 2024.
- Kinetic is the most lucrative type segment registering the fastest growth during the forecast period.
- Country-wise, Canada is expected to register the highest CAGR from 2025 to 2030.
North America data book summary
| Market revenue in 2024 | USD 95.3 million |
| Market revenue in 2030 | USD 128.0 million |
| Growth rate | 5.2% (CAGR from 2025 to 2030) |
| Largest segment | Static |
| Fastest growing segment | Kinetic |
| Historical data covered | 2018 - 2023 |
| Base year for estimation | 2024 |
| Forecast period covered | 2025 - 2030 |
| Quantitative units | Revenue in USD million |
| Market segmentation | Static, Kinetic |
| Key market players worldwide | Carl Zeiss Meditec AG, Haag-Streit USA, Oculus VisionTech Inc, Microvision Inc, Medaro Mining Corp, Topcon Corp, Elkton Eyecare, Heidelberg Engineering, Kowa Pharmaceuticals, Optopol USA |
Other key industry trends
- In terms of revenue, North America region accounted for 45.0% of the global automated visual field analyzer market in 2024.
- Globally, North America is projected to lead the regional market in terms of revenue in 2030.
- Asia Pacific is the fastest growing regional market and is projected to reach USD 65.2 million by 2030.
No credit card required*
Horizon in a snapshot
- 30K+ Global Market Reports
- 120K+ Country Reports
- 1.2M+ Market Statistics
- 200K+ Company Profiles
- Industry insights and more
Automated Visual Field Analyzer Market Scope
Automated Visual Field Analyzer Market Companies
| Name | Profile | # Employees | HQ | Website |
|---|---|---|---|---|
| Optopol USA | View profile | 1-10 | Apex, North Carolina, United States, North America | https://www.optopolusa.com |
| Kowa Pharmaceuticals | View profile | 251-500 | New York, New York, United States, North America | http://kowapharma.com |
| Heidelberg Engineering | View profile | 251-500 | Heidelberg, Baden-Wurttemberg, Germany, Europe | https://www.heidelbergengineering.com/de/ |
| Elkton Eyecare | View profile | 11-50 | Elkton, Virginia, United States, North America | https://elktoneyecare.com |
| Medaro Mining Corp | View profile | - | 333 Terminal Avenue, Suite 220, Vancouver, BC, Canada, V6A 4C1 | https://www.medaromining.com |
| Microvision Inc | View profile | 340 | 18390 NE 68th Street, Redmond, WA, United States, 98052 | https://www.microvision.com |
| Haag-Streit USA | View profile | 501-1000 | Mason, Ohio, United States, North America | http://haag-streit-usa.com |
| Oculus VisionTech Inc | View profile | 3 | 837 West Hastings Street, Suite 507, Vancouver, BC, Canada, V6C 3N6 | https://www.ovtz.com |
| Topcon Corp | View profile | 5543 | 75-1 Hasunuma-cho, Itabashi-ku, Tokyo, Japan, 1748580 | http://www.topcon.co.jp |
| Carl Zeiss Meditec AG | View profile | 4950 | Goschwitzer Strasse 51-52, Jena, TH, Germany, 07745 | https://www.zeiss.com |
North America automated visual field analyzer market outlook
The databook is designed to serve as a comprehensive guide to navigating this sector. The databook focuses on market statistics denoted in the form of revenue and y-o-y growth and CAGR across the globe and regions. A detailed competitive and opportunity analyses related to automated visual field analyzer market will help companies and investors design strategic landscapes.
Static was the largest segment with a revenue share of 68.21% in 2024. Horizon Databook has segmented the North America automated visual field analyzer market based on static, kinetic covering the revenue growth of each sub-segment from 2018 to 2030.
Increase in factors such as aging population, favorable government policies, and healthcare expenditure is expected to drive the regional market. Major factors contributing to this region’s market growth include government support for quality healthcare, high purchasing power parity, availability of reimbursement, and increasing prevalence of eye disorders such as cataracts, glaucoma, & myopia.
According to WHO, the prevalence of myopia and high myopia is predicted to increase in high-income regions of Asia Pacific, North America, and the Middle East. Increasing prevalence of glaucoma and myopia especially in children across Canada & the U.S. is expected to increase the demand for automated visual field analyzers.
According to the American Optometric Association, currently, there are around 45 million people that wear contact lenses in the U.S. Of these, 15.5% are adults (25 years or older), 14.5% are adolescents (less than 17 years), and 24.4% are young adults (between 18 and 24 years).
Reasons to subscribe to North America automated visual field analyzer market databook:
-
Access to comprehensive data: Horizon Databook provides over 1 million market statistics and 20,000+ reports, offering extensive coverage across various industries and regions.
-
Informed decision making: Subscribers gain insights into market trends, customer preferences, and competitor strategies, empowering informed business decisions.
-
Cost-Effective solution: It's recognized as the world's most cost-effective market research database, offering high ROI through its vast repository of data and reports.
-
Customizable reports: Tailored reports and analytics allow companies to drill down into specific markets, demographics, or product segments, adapting to unique business needs.
-
Strategic advantage: By staying updated with the latest market intelligence, companies can stay ahead of competitors, anticipate industry shifts, and capitalize on emerging opportunities.
Target buyers of North America automated visual field analyzer market databook
-
Our clientele includes a mix of automated visual field analyzer market companies, investment firms, advisory firms & academic institutions.
-
30% of our revenue is generated working with investment firms and helping them identify viable opportunity areas.
-
Approximately 65% of our revenue is generated working with competitive intelligence & market intelligence teams of market participants (manufacturers, service providers, etc.).
-
The rest of the revenue is generated working with academic and research not-for-profit institutes. We do our bit of pro-bono by working with these institutions at subsidized rates.
Horizon Databook provides a detailed overview of continent-level data and insights on the North America automated visual field analyzer market , including forecasts for subscribers. This continent databook contains high-level insights into North America automated visual field analyzer market from 2018 to 2030, including revenue numbers, major trends, and company profiles.
Partial client list
North America automated visual field analyzer market report size, by country, 2018-2030 (US$M)

North America Automated Visual Field Analyzer Market Outlook Share, 2024 & 2030 (US$M)


Related industry reports
Related statistics
Sign up - it's easy, and free!
Sign up and get instant basic access to databook, upgrade
when ready, or enjoy our
free plan indefinitely.
Included in Horizon account
- 30K+ Global Market Reports
- 120K+ Country Reports
- 1.2M+ Market Statistics
- 200K+ Company Profiles
- Industry insights and more