U.S. 3d Display Market Size & Outlook, 2023-2030
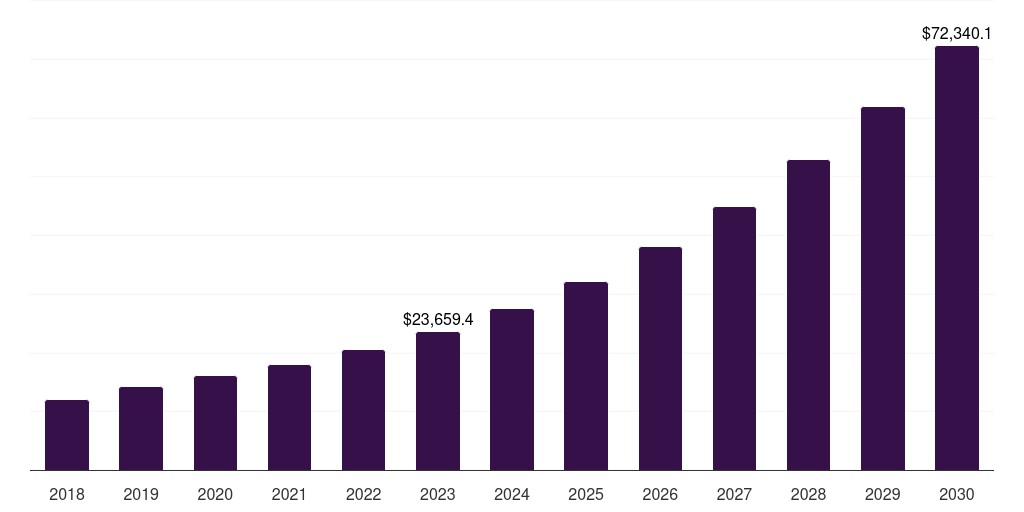
U.S. 3d display market, 2018-2030 (US$M)
Related Markets
U.S. 3d display market highlights
- The U.S. 3d display market generated a revenue of USD 23,659.4 million in 2023 and is expected to reach USD 72,340.1 million by 2030.
- The U.S. market is expected to grow at a CAGR of 17.3% from 2024 to 2030.
- In terms of segment, stereoscopic display was the largest revenue generating product in 2023.
- Head Mounted Display (HMD) is the most lucrative product segment registering the fastest growth during the forecast period.
3d display market data book summary
| Market revenue in 2023 | USD 23,659.4 million |
| Market revenue in 2030 | USD 72,340.1 million |
| Growth rate | 17.3% (CAGR from 2023 to 2030) |
| Largest segment | Stereoscopic display |
| Fastest growing segment | Head Mounted Display (HMD) |
| Historical data | 2018 - 2022 |
| Base year | 2023 |
| Forecast period | 2024 - 2030 |
| Quantitative units | Revenue in USD million |
| Market segmentation | Volumetric Display, Stereoscopic Display, Head Mounted Display (HMD) |
| Key market players worldwide | AUO Corp ADR, Japan Display Inc, LG Electronics Inc ADR, Samsung Electronics Co Ltd, Sharp Corp, Sony Group Corp, Truly International Holdings Ltd, Innolux |
Other key industry trends
- In terms of revenue, U.S. accounted for 19.3% of the global 3d display market in 2023.
- Country-wise, U.S. is expected to lead the global market in terms of revenue in 2030.
- In North America, U.S. 3d display market is projected to lead the regional market in terms of revenue in 2030.
- U.S. is the fastest growing regional market in North America and is projected to reach USD 72,340.1 million by 2030.
No credit card required*
Horizon in a snapshot
- 30K+ Global Market Reports
- 120K+ Country Reports
- 1.2M+ Market Statistics
- 200K+ Company Profiles
- Industry insights and more
3D Display Market Scope
3D Display Market Companies
| Name | Profile | # Employees | HQ | Website |
|---|
U.S. 3d display market outlook
The databook is designed to serve as a comprehensive guide to navigating this sector. The databook focuses on market statistics denoted in the form of revenue and y-o-y growth and CAGR across the globe and regions. A detailed competitive and opportunity analyses related to 3d display market will help companies and investors design strategic landscapes.
Stereoscopic display was the largest segment with a revenue share of 54.64% in 2023. Horizon Databook has segmented the U.S. 3d display market based on volumetric display, stereoscopic display, head mounted display (hmd) covering the revenue growth of each sub-segment from 2018 to 2030.
Reasons to subscribe to U.S. 3d display market databook:
-
Access to comprehensive data: Horizon Databook provides over 1 million market statistics and 20,000+ reports, offering extensive coverage across various industries and regions.
-
Informed decision making: Subscribers gain insights into market trends, customer preferences, and competitor strategies, empowering informed business decisions.
-
Cost-Effective solution: It's recognized as the world's most cost-effective market research database, offering high ROI through its vast repository of data and reports.
-
Customizable reports: Tailored reports and analytics allow companies to drill down into specific markets, demographics, or product segments, adapting to unique business needs.
-
Strategic advantage: By staying updated with the latest market intelligence, companies can stay ahead of competitors, anticipate industry shifts, and capitalize on emerging opportunities.
Target buyers of U.S. 3d display market databook
-
Our clientele includes a mix of 3d display market companies, investment firms, advisory firms & academic institutions.
-
30% of our revenue is generated working with investment firms and helping them identify viable opportunity areas.
-
Approximately 65% of our revenue is generated working with competitive intelligence & market intelligence teams of market participants (manufacturers, service providers, etc.).
-
The rest of the revenue is generated working with academic and research not-for-profit institutes. We do our bit of pro-bono by working with these institutions at subsidized rates.
Horizon Databook provides a detailed overview of country-level data and insights on the U.S. 3d display market , including forecasts for subscribers. This country databook contains high-level insights into U.S. 3d display market from 2018 to 2030, including revenue numbers, major trends, and company profiles.
Partial client list
U.S. 3d display market size, by product, 2018-2030 (US$M)

U.S. 3D Display Market Outlook Share, 2023 & 2030 (US$M)


Related regional statistics
Sign up - it's easy, and free!
Sign up and get instant basic access to databook, upgrade
when ready, or enjoy our
free plan indefinitely.
Included in Horizon account
- 30K+ Global Market Reports
- 120K+ Country Reports
- 1.2M+ Market Statistics
- 200K+ Company Profiles
- Industry insights and more