- Home
- »
- Specialty Glass, Ceramic & Fiber
- »
-
Glass Additives Market Size, Share, Global Industry Report, 2018-2025GVR Report cover
![Glass Additives Market Size, Share & Trends Report]()
Glass Additives Market Size, Share & Trends Analysis Report By Product (Metal Oxide, Nanoparticles, Rare Earth Metals), By End-Use,By Region, And Segment Forecasts, 2018 - 2025
- Report ID: GVR-1-68038-811-4
- Number of Report Pages: 104
- Format: PDF, Horizon Databook
- Historical Range: 2014 - 2016
- Forecast Period: 2017 - 2025
- Industry: Advanced Materials
Industry Insights
The global glass additives market size was estimated at 34.0 kilo tons in 2014. The increasing use of glass products as a packaging material is projected to be a major factor driving market growth around the globe.
Glass, naturally, is brittle in nature and is made from silica. However, owing to the large scale demand for a variety of applications, it is important to manipulate certain properties so as to suit every requirement. Thus, these additives have become an integral part of the global glass production industry.
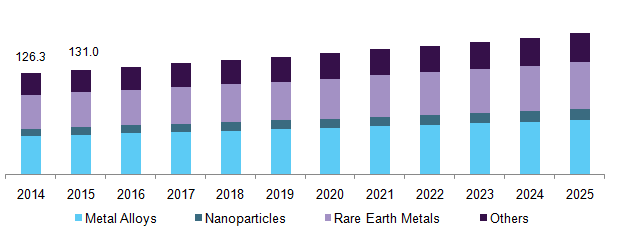
U.S. glass additives market revenue by product, 2014 - 2025 (USD Million)

These additives act as facilitators that help in refining the opaqueness, color, resistance, and refractive index, thereby improving the quality of the final product. On account of these abilities of the product, the use of additives is expected to rise in the future thus driving the market growth.
The intense use of glass bottles and other such items as packaging containers are anticipated to drive the product demand in medical and pharmaceutical applications as well. Rising use of glass in electronics, consumer goods, and fiber optics is expected to foster growth in other applications segment.
However, the availability of alternatives such as plastics, comparatively low cost of plastic additives, and limited reserves of rare earth elements are some of the factors which are expected to restrain the industry growth.
Product Insights
On the basis of product, the glass additives market has been segmented as metal oxides, nanoparticles, rare earth metals, and others. During glass production one or many of these are usually used as additives to enhance the properties.
Metal oxides can be either used for coloring or to improve certain properties such as improving thermal and electrical conductivity. Metal oxides emerged as the largest product segment and is expected to grow at an estimated CAGR of 3.7% from 2017 to 2025. Some of the metal oxides used for coloring include ferric oxide, cobalt oxide, manganese oxide, and many others.
Nanoparticles segment is expected to witness the highest CAGR of 5.1% over the forecast period. Nanoparticles are majorly used as coatings for windows, doors, gadgets, etc. thereby making them scratch resistant. The growing popularity of scratch-resistant window panes for automobiles, mobile phones, laptops, and other electronic devices is anticipated to spur the nanoparticles segment in the product market.
Moreover, reducing the air bubbles to offer lower resistance during sea bottom drilling can be considered as one of the latest examples of nanoparticle additives in the glass industry. Rare earth elements are majorly used as coloring agents and find application in producing decorative products for home interiors, building & packaging, tableware, etc.
End-use Insights
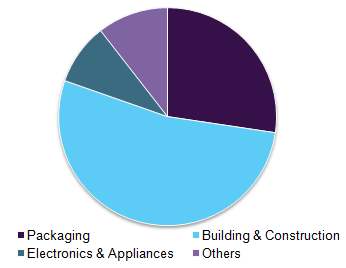
The global demand for glass additives has seen a shift due to rising popularity among consumers for specialized products with enhanced properties such as scratch resistance, water repellency, UV protection, anti-glare, etc. Building & Packaging emerged as the largest end-use segment and accounted for over 53% of the total market demand in 2015.
The end-use segment has been categorized as packaging, building & construction, electronics & appliances, and others. The increasing use of glass as a packaging material has led to the boom in the market which in turn has affected the consumption of additives.
The glass is being widely used to pack various food and beverages such as jams, sauces, jellies, beer, wine, soft drinks, and many other carbonated and non-carbonated drinks. This type of packaging is also widely used in the healthcare industry as it is much more inert than plastic packaging.
Global glass additives market volume by end-use, 2015 (%)

Glass, being 100% recyclable and satisfying all the food security needs, has been granted the FDA's Generally Recognized as Safe (GRAS) status, thus emerging as an attractive packaging material in the food & beverage sector. This segment is anticipated to grow at a CAGR of 3.6% over the forecast period.
Owing to the consumer preferences for strong, opaque glass in building and packaging has led to the increased use of additives. Moreover, the growing demand for reflective glass for window panes and outer wall surfaces in commercial buildings, there is a need to manufacture better quality and all-weather resistant products. Other segments where such enhanced products are used are home and décor, automobile, fiber optics, medical, etc.
Regional Insights
Europe was the leading additives consumer and accounted for around 34% of the total market revenue in 2016. Europe is the largest manufacturer of glass in the world and is home for almost one-third of world production. The segment is expected to generate revenue of USD 533.8 million by 2025.
China is the largest producer of rare earth elements as well as the biggest consumer of glass products in the world. China’s rapid industrialization is supported by strong economic growth. Moreover, the emerging economies such as India and Indonesia have also helped the growth of the Asian market, thus making it the fastest-growing region.
North America is also considered to be growing at a CAGR of 3.8% in terms of revenue owing to the rising consumption levels of glass in pharmaceuticals and automobile sectors. Moreover, the U.S. being a hub for vehicles and electronic gadgets is a leading consumer in North America.
Glass Additives Market Share Insights
The global glass additives industry is highly concentrated, with only a few players accounting for large shares of the world production in 2014. Key market participants include DuPont, Torrecid Group, Nanobase, Gillinder Glass, SCHOTT, and others.
The development of customized items is expected to be the main factor for sustaining the competition in the market. Large enterprises have set up supply partnerships and depicted higher forward and backward integration in the value chain. Moreover, they also need to cope up with challenges such as higher fuel prices, offer premium quality products at affordable prices, and indirect competition from plastic manufacturing firms.
Report Scope
Attribute
Details
Base year for estimation
2016
Actual estimates/Historical data
2014 - 2016
Forecast period
2017 - 2025
Market representation
Volume in tons, revenue in USD Million and CAGR from 2017 to 2025
Regional scope
North America, Europe, Asia Pacific, Central & South America, Middle East & Africa
Country scope
U.S., Germany, U.K., France, China, India, Japan
Report coverage
Revenue forecast, company share, competitive landscape, growth factors and trends
15% free customization scope (equivalent to 5 analyst working days)
If you need specific market information, which is not currently within the scope of the report, we will provide it to you as a part of customization
Segments Covered in the ReportThis report forecasts revenue growth at global, regional & country levels and provides an analysis of the industry trends in each of the sub-segments from 2014 to 2025. For the purpose of this study, Grand View Research has segmented the global glass additives market on the basis of product and region:
-
Product Outlook (Volume, Tons; Revenue, USD Million, 2014 - 2025)
-
Metal Oxide
-
Nanoparticles
-
Rare Earth Metals
-
Others
-
-
End-Use Outlook (Volume, Tons; Revenue, USD Million, 2014 - 2025)
-
Packaging
-
Building & Construction
-
Electronics & Appliances
-
Others
-
-
Regional Outlook (Volume, Tons; Revenue, USD Million, 2014 - 2025)
-
North America
-
The U.S.
-
-
Europe
-
Germany
-
The U.K.
-
France
-
-
Asia Pacific
-
China
-
India
-
Japan
-
-
Central & South America
-
Middle East & Africa
-
Share this report with your colleague or friend.
![gvr icn]()
NEED A CUSTOM REPORT?
We can customize every report - free of charge - including purchasing stand-alone sections or country-level reports, as well as offer affordable discounts for start-ups & universities. Contact us now
![Certified Icon]()
We are GDPR and CCPA compliant! Your transaction & personal information is safe and secure. For more details, please read our privacy policy.
We are committed towards customer satisfaction, and quality service.
"The quality of research they have done for us has been excellent."


